adb shell setprop 、开发者选项-程序员宅基地
技术标签: adb
获取当前打开APP的包名
adb shell "dumpsys activity top | grep ACTIVITY | tail -n 1"

> adb shell "dumpsys activity top | grep ACTIVITY | tail -n 1"
  ACTIVITY com.xq.demo/.MainActivity 28b307b pid=28250
获取当前APP的进程ID
adb shell pidof <package_name>

> adb shell pidof com.xq.demo
28250
打开系统语言设置
adb shell am start -a android.settings.LOCALE_SETTINGS
打开点按和指针显示
#为触摸操作提供视觉提示:触摸点 【0: 关闭点按显示,1: 开启点按显示】
adb shell settings put system show_touches 1
adb shell settings put system show_touches 0

# 屏幕叠加层显示当前触摸数据:坐标【0: 关闭指针显示,1: 开启指针显示】
adb shell settings put system pointer_location 1
adb shell settings put system pointer_location 0
一、开启 GPU Render 的profiling bar: Gpu渲染速度
adb shell setprop debug.hwui.profile true
adb shell setprop debug.hwui.profile visual_bars
adb shell setprop debug.hwui.profile visual_lines

adb shell setprop debug.hwui.profile false

#控制汇总条长度
adb shell setprop debug.hwui.profile.maxframes 400
效果如下:

其中, Android 6.0 及更高版本的设备时分析器输出中某个竖条的每个区段如下所示:
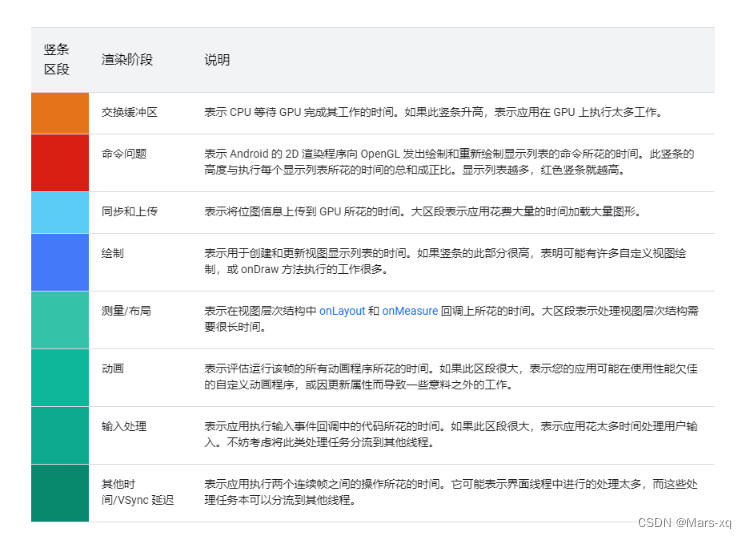
下表显示的是 Android 4.0 和 5.0 中的竖条区段。

系统源码 :
/**
 * System property used to enable or disable hardware rendering profiling.
 * The default value of this property is assumed to be false.
 * When profiling is enabled, the adb shell dumpsys gfxinfo command will
 * output extra information about the time taken to execute by the last
 * frames.
 * Possible values:
 * "true",        to enable profiling
 * "visual_bars", to enable profiling and visualize the results on screen
 * "false",       to disable profiling
 * @see #PROFILE_PROPERTY_VISUALIZE_BARS
 * @hide
 */
public static final String PROFILE_PROPERTY = "debug.hwui.profile";
/**
 * System property used to specify the number of frames to be used
 * when doing hardware rendering profiling.
 * The default value of this property is #PROFILE_MAX_FRAMES.
 *
 * When profiling is enabled, the adb shell dumpsys gfxinfo command will
 * output extra information about the time taken to execute by the last
 * frames.
 *
 * Possible values:
 * "60", to set the limit of frames to 60
 */
static final String PROFILE_MAXFRAMES_PROPERTY = "debug.hwui.profile.maxframes";
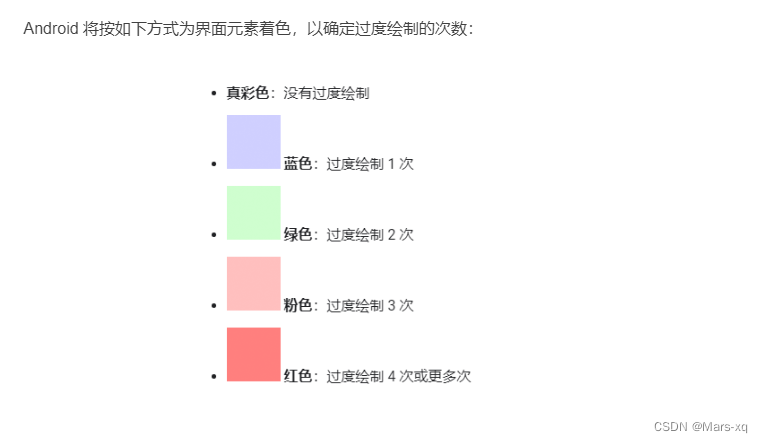
二、打开 Overdraw 检查 : GPU过度绘制
adb shell setprop debug.hwui.overdraw show

#

adb shell setprop debug.hwui.overdraw false

系统源码:
/*
 * Controls overdraw debugging.
 *
 * Possible values:
 * "false", to disable overdraw debugging
 * "show",  to show overdraw areas on screen
 * "count", to display an overdraw counter
 *
 * @hide
 */
public static final String DEBUG_OVERDRAW_PROPERTY = "debug.hwui.overdraw";
三、开启显示各个view的布局线 : 布局边界
adb shell setprop debug.layout true

#

adb shell setprop debug.layout false

系统源码 :
/**
 * When set to true, apps will draw debugging information about their layouts.
 *
 * @hide
 */
public static final String DEBUG_LAYOUT_PROPERTY = "debug.layout";
四、查看dirty区域:
adb shell setprop debug.hwui.show_dirty_regions true

adb shell setprop debug.hwui.render_dirty_regions true
系统源码:
/**
* System property used to enable or disable dirty regions invalidation.
* This property is only queried if {@link #RENDER_DIRTY_REGIONS} is true.
* The default value of this property is assumed to be true.
*
* Possible values:
* "true",  to enable partial invalidates
* "false", to disable partial invalidates
*/
static final String RENDER_DIRTY_REGIONS_PROPERTY = "debug.hwui.render_dirty_regions";


/**
* Turn on to draw dirty regions every other frame.
*
* Possible values:
* "true",  to enable dirty regions debugging
* "false", to disable dirty regions debugging
*
* @hide
*/
public static final String DEBUG_DIRTY_REGIONS_PROPERTY = "debug.hwui.show_dirty_regions";
五、log日志
# 使能所有log tag 输出,设置所有log V等级及以上的log才能输出
adb shell setprop persist.log.tag V
智能推荐
电脑硬件——显卡_显卡分类-程序员宅基地
文章浏览阅读3.9k次,点赞20次,收藏86次。显卡的工作是负责画面的渲染和输出,例如你在玩一个大型游戏,CPU的工作是根据游戏预设的各种算法计算出接下来会发生什么,并折合成海量的数据发送给显卡,显卡再对这些数据进行计算,渲染成1帧1帧的图像,传输到显示器,从而将画面呈现在我们眼前,而且显卡是在实时计算渲染,所以对显卡性能的要求就非常高,因此这就是我们平常所说的你想打游戏,就得有一张好的显卡。而看视频就不一样了,视频资源是已经被计算好的数据,先看只负责简单处理再输出就可以了,不需要再自己计算。就类比写作业,玩游戏就是自己计算然后写在本子上,看视频就是抄作_显卡分类
点云配准经典算法ICP复现 C++ Win10 pcl1.11.1_method for registration of 3-d shapes-程序员宅基地
文章浏览阅读1.7k次,点赞4次,收藏25次。背景ICP算法是点云配准(registration)领域的主流算法,在学习过程中我尝试使用C++复现了ICP算法。我参考的是经典ICP论"P. Besl, N. McKay. ‘A Method for Registration of 3-D Shapes,’ IEEE Trans. on Pattern Analysis and Machine Intel., vol. 14, no. 2, pp. 239-256,1992"。建议论文和代码搭配阅读。环境windows10 + pcl1.11.1_method for registration of 3-d shapes
springmvc的前端控制器对css、js等进行过滤_spring 过滤js代码-程序员宅基地
文章浏览阅读3.7k次。web.xml配置如下: springm_spring 过滤js代码
游戏中任务系统设计_游戏任务种类-程序员宅基地
文章浏览阅读8.5k次,点赞2次,收藏17次。1、任务分类 游戏中任务可以分为主线任务、支线任务、日常任务、周任务、节日活动任务,其中周任务和节日任务可以根据设定的日期进行开启关闭,属于重复性任务。2、游戏条件 各类任务开启条件:1、玩家等级 2、玩家攻击力3、前置任务等等 完成条件:玩家进行任务进度是否达成 任务关闭:1、玩家领取奖励后关闭任务。2、时间过期3..._游戏任务种类
ACM / ICPC 在线OJ(Online judge)_清华大学 acm网站-程序员宅基地
文章浏览阅读6.4k次,点赞8次,收藏35次。1. codeforces codeforces(这个网站每天会有比赛,一起打CF吧!)http://codeforces.com/problemset2. topcoder:http://www.topcoder.com/challenges/3. kattis 这个网站有历年的ICPC真题 https://open.kattis.com/4. 洛谷:..._清华大学 acm网站
基于语法-CreateFile_::createfilea中文打不开-程序员宅基地
文章浏览阅读599次。可行1:当E:\\a.txt 已经存在,且程序字符=Unicode的时候,下面代码可以正常#include <iostream>#include <windows.h>int main(){ HANDLE hFILE = (HANDLE)CreateFile(L"E:\\a.txt", GENERIC_READ, FILE_SHARE_READ, NULL, OPEN_EXISTING, NULL, NULL); if (hFILE == INVALID__::createfilea中文打不开
随便推点
oracle 查询是否包含某字符串_oracle包含某个字段-程序员宅基地
文章浏览阅读7.9k次,点赞4次,收藏9次。1、like 2、contains 3、instr 4、regexp_like_oracle包含某个字段
骨架提取之AdaLSN_线性跨度网络-程序员宅基地
文章浏览阅读1.1k次,点赞2次,收藏10次。paper:https://arxiv.org/pdf/2011.03972.pdfcode:https://github.com/sunsmarterjie/SDL-Skeleton摘要传统的物体骨架检测网络通常是手工制作的。 虽然有效,但它们需要密集的先验知识来为不同粒度的对象配置具有代表性的特征。 本文提出了自适应线性跨度网络(AdaLSN),在神经架构搜索(NAS)的驱动下,自动配置和集成目标骨架检测的尺度感知特征。AdaLSN是用线性跨度理论建立的,它为多尺度深度特征融合提供了最早的解释之一_线性跨度网络
python的内存管理机制_python 创建金字塔 显示大内存图片-程序员宅基地
文章浏览阅读662次。python的内存管理机制先从较浅的层面来说,Python的内存管理机制可以从三个方面来讲(1)垃圾回收(2)引用计数(3)内存池机制一、垃圾回收:python不像C++,Java等语言一样,他们可以不用事先声明变量类型而直接对变量进行赋值。对Python语言来讲,对象的类型和内存都是在运行时确定的。这也是为什么我们称Python语言为动态类型的原因(这里我们把动态类型可以简单的归结为对变量内存地址_python 创建金字塔 显示大内存图片
Qt多语言支持_qt translate file语言选什么-程序员宅基地
文章浏览阅读547次。试用QT中的多语言翻译基本原理:为了在使用多语言,必须做两件事情:1,把想要翻译的字符串放入tr()中,如 QString str=tr("Legal");2, 在开始的时候载入预先制作好的翻译文件(.qm)。以下利用Qt提供的工具,把翻译文件制作出来,并在程_qt translate file语言选什么
Atitit 性能指标与性能提升的5个原则与性能提升模型_升级性能指标-程序员宅基地
文章浏览阅读433次。Atitit 性能指标与性能提升的5个原则与性能提升模型 1. 性能的几个指标主要是响应时间(Response time) 2.吞吐量(Throughput)12. 性能提升的5个原则与性能提升模型 22.1. 分类优先级,与分区域,减少要操作或提取的内容与范围 22.2. div分而治之 聚沙成塔 分布式并发 22.3. 大力提升单体处理能力 22.4. _升级性能指标
华为电视鸿蒙安装第三方软件,新款华为智慧屏如何安装第三方软件?最详细的安装教程详解...-程序员宅基地
文章浏览阅读5.3k次。12月17日,华为终端官方微博公布了新品信息,预告新款华为智慧屏将于12月21日下午14时的华为全屋智能及智慧屏新品发布会上正式亮相。华为智慧屏宣传海报文案透露出此次新款华为智慧屏将在语音及智能交互上带来惊喜体验。且在此之前,华为消费者业务IoT产品线总裁支浩曾透露发布于年底的全新华为智慧屏系列将定位大众娱乐。另外,随着鸿蒙系统2.0的升级,华为智慧屏系列也正式成为首批搭载鸿蒙2.0的终端产品。根..._华为电视安装第三方软件