MPAndroidChat的PieChart和BarChart学习_mpandroidchar 动画-程序员宅基地
技术标签: android应用开发
先把要写的写下来,有时间再详写
之前学MPAndroidChat主要看了这个人的博文http://blog.csdn.net/shineflowers/article/details/44809119,但是发现和github上的内容有出入,仔细研究了后发现github上的代码原来一直在更新,博主只是因为版本低所以不一样,所以我从github上导出工程后再导出jar包就是最新的了。
下面的中文说明http://www.jianshu.com/p/c049389d348a?nomobile=yes
---------------------------------------------------------------------------------------------------------------------------------------------------
今天算是有时间了 ,抽点时间把图表内容总结一下,有部分是copy上述引用博文的,有部分是自己总结的,代码如下:
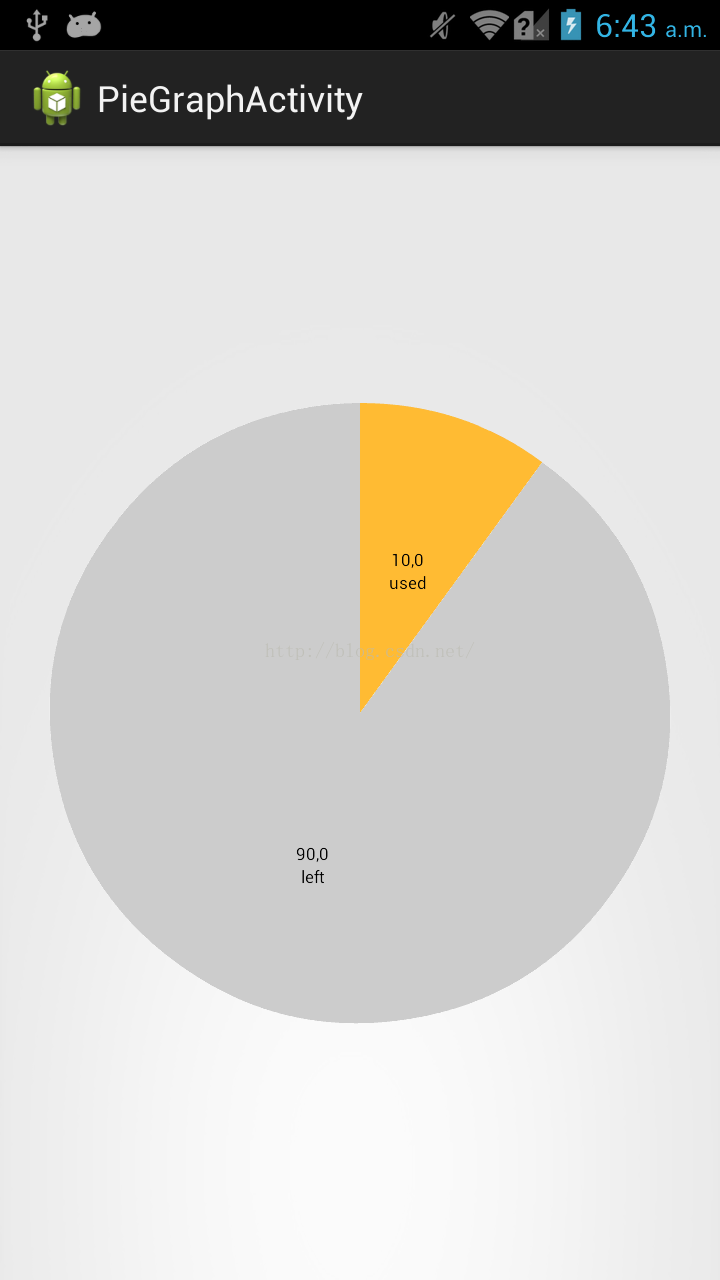
饼型图:
package myapp.charttest;

import java.util.ArrayList;

import android.app.Activity;
import android.graphics.Color;
import android.os.Bundle;

import com.github.mikephil.charting.charts.PieChart;
import com.github.mikephil.charting.components.Legend;
import com.github.mikephil.charting.data.Entry;
import com.github.mikephil.charting.data.PieData;
import com.github.mikephil.charting.data.PieDataSet;

public class PieGraphActivity extends Activity {
    PieChart pieChart;

	@Override
	protected void onCreate(Bundle savedInstanceState) {
		super.onCreate(savedInstanceState);
		setContentView(R.layout.activity_pie_graph);
		init();
		setChart();
	}

	public void init(){
		pieChart=(PieChart)findViewById(R.id.pie_chart);
	}

	public void setChart(){

		//名字
		ArrayList<String> names=new ArrayList<String>();
		names.add("used");
		names.add("left");
		//大小
		ArrayList<Entry> sizes=new ArrayList<Entry>();
		sizes.add(new Entry(10,0));
		sizes.add(new Entry(90,1));
		//颜色
		ArrayList<Integer> colors=new ArrayList<Integer>();
        colors.add(Color.parseColor("#FFBB33"));
        colors.add(Color.parseColor("#CCCCCC"));

		PieDataSet pieDataSet=new PieDataSet(sizes,"");//参数:颜色栏显示颜色目录、
		//pieDataSet.setDrawValues(false);//是否在块上面显示值以及百分百
		//pieDataSet.setSliceSpace(0f);//块间距
		pieDataSet.setColors(colors);


		//DisplayMetrics metrics=this.getResources().getDisplayMetrics();
		PieData pieData=new PieData(names,pieDataSet);


		pieChart.setTransparentCircleRadius(0f);//设置大圆里面透明小圆半径,和洞不是一个圆

		pieChart.setDrawHoleEnabled(true);
		//pieChart.setHoleColorTransparent(true);//设置中心洞是否透明:true为黑,false为白
		pieChart.setHoleRadius(0f);//设置大圆里面的无色圆的半径(洞...)


		pieChart.setDescription("");//参数:右下角显示图形描述

		pieChart.setDrawCenterText(false);//不显示图中心文字
		pieChart.setCenterText("traffic graph");//图中心文字
		pieChart.setRotationEnabled(false);//不能手动旋转

		//pieChart.setDrawMarkerViews(false);
		//pieChart.setDrawSliceText(false);//块的文本是否显示


		pieChart.setData(pieData);

		Legend legend=pieChart.getLegend();
		legend.setEnabled(false);//是否显示图形说明,必须要放在setData后,否则出错

		//两个参数有不同的意思:
		//durationMillisX:每个块运行到固定初始位置的时间
		//durationMillisY: 每个块到绘制结束时间
		pieChart.animateXY(1000, 1000);//设置动画(参数为时间)

	}


}
显示结果:
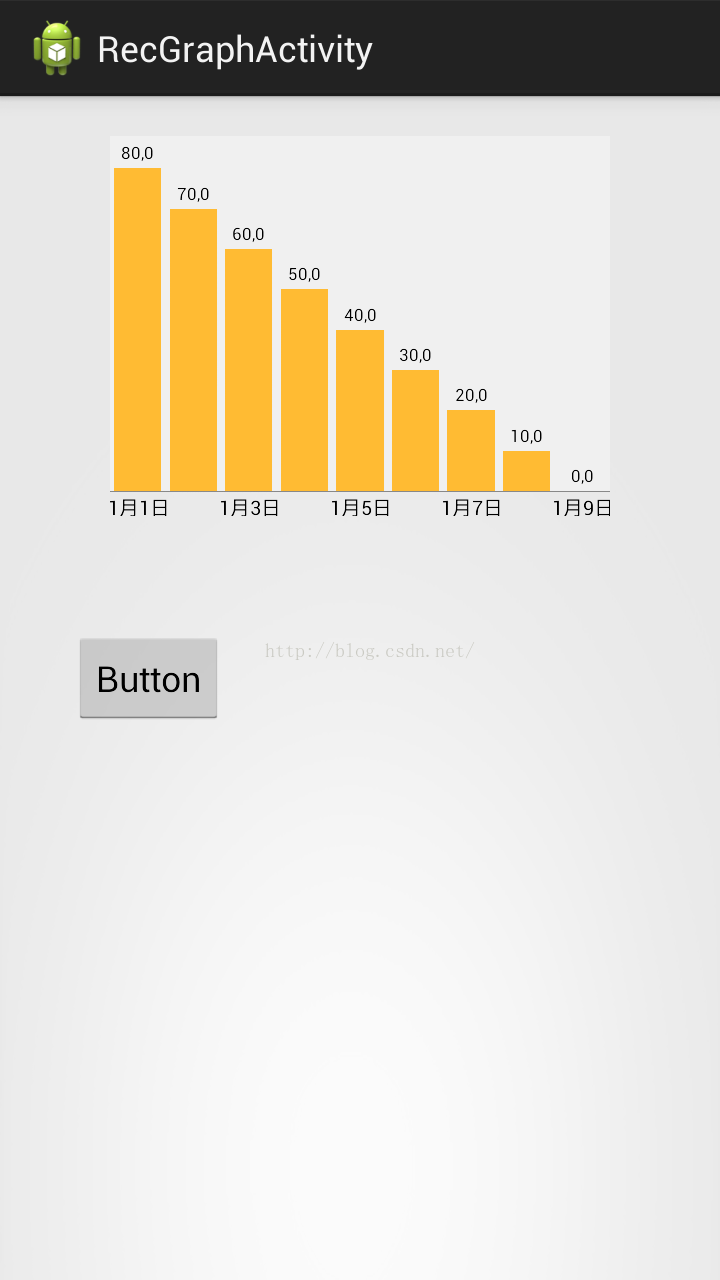
直方图:
package myapp.charttest;

import java.util.ArrayList;

import android.app.Activity;
import android.graphics.Color;
import android.os.Bundle;
import android.view.WindowManager;

import com.github.mikephil.charting.charts.BarChart;
import com.github.mikephil.charting.components.Legend;
import com.github.mikephil.charting.components.XAxis;
import com.github.mikephil.charting.components.XAxis.XAxisPosition;
import com.github.mikephil.charting.components.YAxis;
import com.github.mikephil.charting.components.YAxis.YAxisLabelPosition;
import com.github.mikephil.charting.data.BarData;
import com.github.mikephil.charting.data.BarDataSet;
import com.github.mikephil.charting.data.BarEntry;

public class RecGraphActivity extends Activity {
	BarChart barChart;

	@Override
	protected void onCreate(Bundle savedInstanceState) {
		super.onCreate(savedInstanceState);

		getWindow().setFlags(WindowManager.LayoutParams.FLAG_FULLSCREEN,
                WindowManager.LayoutParams.FLAG_FULLSCREEN);

		setContentView(R.layout.activity_rec_graph);
		init();
		setData();
	}

	public void init(){
		barChart=(BarChart)findViewById(R.id.bar_chart);
	}

	public void setData(){
		//名称
		ArrayList<String> names=new ArrayList<String>();
		names.add("1月1日");
		names.add("1月2日");
		names.add("1月3日");
		names.add("1月4日");
		names.add("1月5日");
		names.add("1月6日");
		names.add("1月7日");
		names.add("1月8日");
		names.add("1月9日");
		//大小(高低)
		ArrayList<BarEntry> sizes=new ArrayList<BarEntry>();
		sizes.add(new BarEntry(80,0));
		sizes.add(new BarEntry(70,1));
		sizes.add(new BarEntry(60,2));
		sizes.add(new BarEntry(50,3));
		sizes.add(new BarEntry(40,4));
		sizes.add(new BarEntry(30,5));
		sizes.add(new BarEntry(20,6));
		sizes.add(new BarEntry(10,7));
		sizes.add(new BarEntry(0,8));

		//颜色
		BarDataSet barDataSet=new BarDataSet(sizes,"");
		barDataSet.setColor(Color.parseColor("#FFBB33"));

		BarData barData=new BarData(names,barDataSet);

		barChart.setDescription("");//数据描述
		barChart.setNoDataTextDescription("No Data");//没有数据时显示

		//barChart.setDragEnabled(false);//拖拽(蛋疼)

		barChart.setScaleEnabled(true);//手动缩放效果
		barChart.setPinchZoom(false);//xy轴同时缩放,和setScaleEnabled一起使用

		barChart.setHighlightPerTapEnabled(true);//按下时高亮显示

		//barChart.setDrawGridBackground(false);
		//barChart.setDrawBorders(false);//画布边框

		//barChart.setVisibleXRange(7);
		//barChart.setMaxVisibleValueCount(6);
		barChart.setDrawBarShadow(false);//设置矩形阴影不显示
		barChart.setBackgroundColor(Color.parseColor("#FFFFFF"));//设置背景颜色

		barChart.setMinOffset(0);//=padding
		barChart.setDrawValueAboveBar(true);

		barChart.setData(barData);
		barChart.animateXY(1000, 1000);//设置动画

		Legend legend=barChart.getLegend();//取消图形说明
		legend.setEnabled(false);

		//获取X轴坐标
		XAxis xAxis=barChart.getXAxis();
		xAxis.setPosition(XAxisPosition.BOTTOM);//X坐标位于图标底部
		xAxis.setDrawGridLines(false);
		xAxis.setSpaceBetweenLabels(2);//设置名字names之间的间距
		//xAxis.

		//获取Y轴右坐标
		YAxis yAxisR=barChart.getAxisRight();
		yAxisR.setEnabled(false);
		yAxisR.setDrawGridLines(false);

		//获取Y轴左坐标
		YAxis yAxisL=barChart.getAxisLeft();
		yAxisL.setEnabled(false);
		yAxisL.setDrawGridLines(false);
	}
}
显示结果:
遇到的相关问题:
1:barChart的横坐标值没有显示。原因:视图中图表控件高度是match_parent,需要增加属性android:layout_marginBottom="35dp"(或者其他值)
--------------------------------------------------------------------------------------------------------------------------------------------------
大叫好,今天又有时间写博文了,之前上传了图片没看,今天一瞧真TM大,尴尬了......
嗯,继续解决上述第二个问题,今天看了一天的源代码,是在没有找到能够初始化柱子的函数,悲剧,所以只能从其他方法入手,我的想法是让柱子的总数一定,比如30天,有30个数据,但是我要它只显示7个数据,我们可以让直方图放大四倍,这样显示在屏幕上的就是7个数据了,好了有了目标就可以动手了
首先我们发现直方图自己就有缩放功能,于是我们看看能不能修改源代码,自己新增一下借口和改一下源代码:
这段代码是在BarLineChartTouchListener类中,处理触摸事件
public boolean onTouch(View v, MotionEvent event) {

        if (mVelocityTracker == null) {
            mVelocityTracker = VelocityTracker.obtain();
        }
        mVelocityTracker.addMovement(event);

        if (event.getActionMasked() == MotionEvent.ACTION_CANCEL) {
            if (mVelocityTracker != null) {
                mVelocityTracker.recycle();
                mVelocityTracker = null;
            }
        }

        if (mTouchMode == NONE) {
            mGestureDetector.onTouchEvent(event);
        }

        if (!mChart.isDragEnabled() && (!mChart.isScaleXEnabled() && !mChart.isScaleYEnabled()))
            return true;

        // Handle touch events here...
        switch (event.getAction() & MotionEvent.ACTION_MASK) {

            case MotionEvent.ACTION_DOWN:

                startAction(event);

                stopDeceleration();

                saveTouchStart(event);

                break;
            case MotionEvent.ACTION_POINTER_DOWN:

                if (event.getPointerCount() >= 2) {

                    mChart.disableScroll();

                    saveTouchStart(event);

                    // get the distance between the pointers on the x-axis
                    mSavedXDist = getXDist(event);

                    // get the distance between the pointers on the y-axis
                    mSavedYDist = getYDist(event);

                    // get the total distance between the pointers
                    mSavedDist = spacing(event);

                    if (mSavedDist > 10f) {

                        if (mChart.isPinchZoomEnabled()) {
                            mTouchMode = PINCH_ZOOM;
                        } else {
                            if (mSavedXDist > mSavedYDist)
                                mTouchMode = X_ZOOM;
                            else
                                mTouchMode = Y_ZOOM;
                        }
                    }

                    // determine the touch-pointer center
                    midPoint(mTouchPointCenter, event);
                }
                break;
            case MotionEvent.ACTION_MOVE:

                if (mTouchMode == DRAG) {

                    mChart.disableScroll();
                    performDrag(event);

                } else if (mTouchMode == X_ZOOM || mTouchMode == Y_ZOOM || mTouchMode == PINCH_ZOOM) {

                    mChart.disableScroll();

                    if (mChart.isScaleXEnabled() || mChart.isScaleYEnabled())
                        performZoom(event);

                } else if (mTouchMode == NONE
                        && Math.abs(distance(event.getX(), mTouchStartPoint.x, event.getY(),
                                mTouchStartPoint.y)) > 5f) {


                    if (mChart.hasNoDragOffset()) {

                        if (!mChart.isFullyZoomedOut() && mChart.isDragEnabled()) {
                            mTouchMode = DRAG;
                        } else {

                            mLastGesture = ChartGesture.DRAG;

                            if (mChart.isHighlightPerDragEnabled())
                                performHighlightDrag(event);
                        }

                    } else if (mChart.isDragEnabled()) {
                        mLastGesture = ChartGesture.DRAG;
                        mTouchMode = DRAG;
                    }
                }
                break;

            case MotionEvent.ACTION_UP:

                final VelocityTracker velocityTracker = mVelocityTracker;
                final int pointerId = event.getPointerId(0);
                velocityTracker.computeCurrentVelocity(1000, Utils.getMaximumFlingVelocity());
                final float velocityY = velocityTracker.getYVelocity(pointerId);
                final float velocityX = velocityTracker.getXVelocity(pointerId);

                if (Math.abs(velocityX) > Utils.getMinimumFlingVelocity() ||
                        Math.abs(velocityY) > Utils.getMinimumFlingVelocity()) {

                    if (mTouchMode == DRAG && mChart.isDragDecelerationEnabled()) {

                        stopDeceleration();

                        mDecelerationLastTime = AnimationUtils.currentAnimationTimeMillis();
                        mDecelerationCurrentPoint = new PointF(event.getX(), event.getY());
                        mDecelerationVelocity = new PointF(velocityX, velocityY);

                        Utils.postInvalidateOnAnimation(mChart); // This causes computeScroll to fire, recommended for this by Google
                    }
                }

                if (mTouchMode == X_ZOOM ||
                        mTouchMode == Y_ZOOM ||
                        mTouchMode == PINCH_ZOOM ||
                        mTouchMode == POST_ZOOM) {

                    // Range might have changed, which means that Y-axis labels
                    // could have changed in size, affecting Y-axis size.
                    // So we need to recalculate offsets.
                    mChart.calculateOffsets();
                    mChart.postInvalidate();
                }

                mTouchMode = NONE;
                mChart.enableScroll();

                if (mVelocityTracker != null) {
                    mVelocityTracker.recycle();
                    mVelocityTracker = null;
                }

                endAction(event);

                break;
            case MotionEvent.ACTION_POINTER_UP:
                Utils.velocityTrackerPointerUpCleanUpIfNecessary(event, mVelocityTracker);

                mTouchMode = POST_ZOOM;
                break;

            case MotionEvent.ACTION_CANCEL:

                mTouchMode = NONE;
                endAction(event);
                break;
        }

        // Perform the transformation, update the chart
        // if (needsRefresh())
        mMatrix = mChart.getViewPortHandler().refresh(mMatrix, mChart, true);

        return true; // indicate event was handled
    }
private void performZoom(MotionEvent event) {

        if (event.getPointerCount() >= 2) {

            OnChartGestureListener l = mChart.getOnChartGestureListener();

            // get the distance between the pointers of the touch
            // event
            float totalDist = spacing(event);

            if (totalDist > 10f) {

                // get the translation
                PointF t = getTrans(mTouchPointCenter.x, mTouchPointCenter.y);

                // take actions depending on the activated touch
                // mode
                if (mTouchMode == PINCH_ZOOM) {

                    mLastGesture = ChartGesture.PINCH_ZOOM;

                    float scale = totalDist / mSavedDist; // total scale

                    boolean isZoomingOut = (scale < 1);
                    boolean canZoomMoreX = isZoomingOut ?
                            mChart.getViewPortHandler().canZoomOutMoreX() :
                            mChart.getViewPortHandler().canZoomInMoreX();

                    float scaleX = (mChart.isScaleXEnabled()) ? scale : 1f;
                    float scaleY = (mChart.isScaleYEnabled()) ? scale : 1f;

                    if (mChart.isScaleYEnabled() || canZoomMoreX) {
                    	Log.v("performZoom", "PINCH_ZOOM :scaleX:"+scaleX+" scaleY "+scaleY);
                        mMatrix.set(mSavedMatrix);
                        mMatrix.postScale(scaleX, scaleY, t.x, t.y);
                        if (l != null){
                        	l.onChartScale(event, scaleX, scaleY);

                        }

                    }

                } else if (mTouchMode == X_ZOOM && mChart.isScaleXEnabled()) {

                    mLastGesture = ChartGesture.X_ZOOM;

                    float xDist = getXDist(event);
                    float scaleX = xDist / mSavedXDist; // x-axis scale

                    boolean isZoomingOut = (scaleX < 1);
                    boolean canZoomMoreX = isZoomingOut ?
                            mChart.getViewPortHandler().canZoomOutMoreX() :
                            mChart.getViewPortHandler().canZoomInMoreX();

                    if (canZoomMoreX) {

                        mMatrix.set(mSavedMatrix);
                        mMatrix.postScale(scaleX, 1f, t.x, t.y);
                        Log.v("performZoom", "scaleX:"+scaleX);
                        Log.v("performZoom", "l!=null:"+(l != null));
                        Log.v("performZoom", "isZoomingOut:"+isZoomingOut);
                        Log.v("performZoom", "canZoomMoreX:"+canZoomMoreX);
                        Log.v("performZoom", "class :"+this.getClass().getName());
                        if (l != null){
                        	l.onChartScale(event, scaleX, 1f);
                        	Log.v("performZoom", "onChartScale :scaleX:"+scaleX);
                        	Log.v("performZoom", "class ::"+this.getClass().getName());
                        }

                    }

                } else if (mTouchMode == Y_ZOOM && mChart.isScaleYEnabled()) {

                    mLastGesture = ChartGesture.Y_ZOOM;

                    float yDist = getYDist(event);
                    float scaleY = yDist / mSavedYDist; // y-axis scale

                    mMatrix.set(mSavedMatrix);

                    // y-axis comes from top to bottom, revert y
                    mMatrix.postScale(1f, scaleY, t.x, t.y);

                    if (l != null)
                        l.onChartScale(event, 1f, scaleY);
                }
            }
        }
}l.onChartScale(event, 1f, scaleY);虽然线索断了,但是也不能就此放弃,这个过程中我们知道了一个单词Zoom,咦,是不是有点熟悉,在BarChart的方法中好像有这些方法,嗯,没错:
/**
     * Zooms in by 1.4f, into the charts center. center.
     */
    public void zoomIn() {
        Matrix save = mViewPortHandler.zoomIn(getWidth() / 2f, -(getHeight() / 2f));
        mViewPortHandler.refresh(save, this, true);

        // Range might have changed, which means that Y-axis labels
        // could have changed in size, affecting Y-axis size.
        // So we need to recalculate offsets.
        calculateOffsets();
        postInvalidate();
    }

    /**
     * Zooms out by 0.7f, from the charts center. center.
     */
    public void zoomOut() {
        Matrix save = mViewPortHandler.zoomOut(getWidth() / 2f, -(getHeight() / 2f));
        mViewPortHandler.refresh(save, this, true);

        // Range might have changed, which means that Y-axis labels
        // could have changed in size, affecting Y-axis size.
        // So we need to recalculate offsets.
        calculateOffsets();
        postInvalidate();
    }

    /**
     * Zooms in or out by the given scale factor. x and y are the coordinates
     * (in pixels) of the zoom center.
     *
     * @param scaleX if < 1f --> zoom out, if > 1f --> zoom in
     * @param scaleY if < 1f --> zoom out, if > 1f --> zoom in
     * @param x
     * @param y
     */
    public void zoom(float scaleX, float scaleY, float x, float y) {
        Matrix save = mViewPortHandler.zoom(scaleX, scaleY, x, -y);
        mViewPortHandler.refresh(save, this, true);

        // Range might have changed, which means that Y-axis labels
        // could have changed in size, affecting Y-axis size.
        // So we need to recalculate offsets.
        calculateOffsets();
        postInvalidate();
    }
(虽然过程似乎超乎意料,但是结果像是也在情理之中,就这样把)
智能推荐
MySQL中的SET数据类型详解_mysql set-程序员宅基地
文章浏览阅读856次,点赞3次,收藏4次。创建一个SET类型的列时,你需要定义可能的值集合。这里可以存储任何这些值的组合,包括全部都不选。当向SET类型的列插入数据时,你可以插入定义的任何值的组合。_mysql set
matlab print dmeta,[转载]转:MATLAB导出高清晰图片-程序员宅基地
文章浏览阅读143次。一个写论文用的小技巧,MATLAB产生的图片如何导出来合适大小或者符合编辑部要求的图片:使用print命令,如下:用于LaTeX的话,可以使用eps图片:print -deps fig1用于word的话,使用分辨率比较高的tif或者png格式即可:print -dtiff -r500 fig1产生的图片fig1插入到word中就可以满足要求的哦~~-------------------------..._matlab中print-dbitmap是什么意思
高效能人士七个习惯及提升_高效人士的七个习惯 发展目标-程序员宅基地
文章浏览阅读1.1k次。1. 积极主动:他们知道要为自己的抉择负责,做出的选择总是基于原则和价值观,而不是基于情绪或受限于周围(天气环境,社会天气)。 自我感觉:可以自我选择是否痛苦,当你面对痛苦,囫囵吞枣般咽下这苦口良药,并承认是自己选择了痛苦之后,你的确依然可以选择不痛苦(就当没咽下痛苦这回事,从而更别去因自己的痛苦影响别人)。因此伤害我们的并非悲惨遭遇本身,而是我们对于悲惨遭遇的回应!尽管这些_高效人士的七个习惯 发展目标
word自动生成目录--小写字母变大写_word目录强制大写-程序员宅基地
文章浏览阅读1.5w次,点赞3次,收藏4次。哪一级标题有出现小写字母变大写的情况就选中该目录在工具栏中点击引用点击目录下的倒三角,选择插入目录在出现的对话框中选择右下角的修改选择对话框左下角的格式—字体,去掉对话框中的小型大写字母确定,完成_word目录强制大写
电路设计模拟地AGND和数字地GND如何连接_单片机 ad agnd gnd直接连接-程序员宅基地
文章浏览阅读600次,点赞9次,收藏8次。仅作学习记录,欢迎指正。_单片机 ad agnd gnd直接连接
oracle voting disk 大小,2.Oracle Voting Disk 管理-程序员宅基地
文章浏览阅读178次。Oracle Voting Disk 管理2018-01-17 Oracle 宅必备上节介绍运行集群环境所需的进程,这节总体上说Oracle集群的安装,升级以及克隆等Oracle Clusterware 包含了2个重要的组件用来管理配置和节点成员,分别是Oracle Cluster Registry (OCR)以及voting disks,其中OCR还包含一个本地的组件Oracle Local R..._oracle asm vote disk 大小
随便推点
android 标题字体大小,android setTitle怎么实现字体的大小-程序员宅基地
文章浏览阅读279次。烧仙草VB主题里添加如下,可以修改title的字体的大小和样式比如没有ActionBar的Activity中,定义如下的样式false@style/WindowTitle#fff20spbold如果是在ActionBar存在的前提下,主题样式要如下@style/TextAppearance@color/main_color@style/ActionBar@style/TextAppearance..._安卓settitle 设置字体大小
[Unity基础]打包与读取AssetBundle_解包出来的prefab怎么读取-程序员宅基地
文章浏览阅读3.3k次。原文链接:http://www.xuanyusong.com/archives/24051.打包prefabusing UnityEngine;using System.Collections;using UnityEditor;//选择的物体放在不同的ABpublic class CreateAB_Respectively : MonoBehaviour {_解包出来的prefab怎么读取
关于JVM-三色标记算法剖析-程序员宅基地
文章浏览阅读424次。白色:表示对象未被垃圾收集器访问过,这是可达性分析开始的阶段,所有的对象都是白色,如果分析结束阶段,还是白色,即代表不可达。灰色:表示对象被垃圾收集器访问过,但是至少还有一个引用没有被扫描过。黑色:表示对象已被垃圾收集器访问过了,并且这个对象所有对象都被扫描过了,它是安全存活的,如果有其它对象引用指向了黑色对象,无须重新扫描一遍。黑色对象不可能直接指向某个白色对象。
如何快速调出软键盘_天生我材必有用 | 如何快速的计算和调用防火阀、调节阀、铝合金风口等材料价格...-程序员宅基地
文章浏览阅读291次。应用场景:在项目中,通常会遇到防火阀、调节阀、铝合金风口等材料,已知其规格尺寸,需要通过计算公式,得出其价格,如下表所示。在品茗胜算软件里,在“工料汇总”界面调用我材助手,找到对应材料,点击“风阀风口”,软件内置了计算公式,自动读取规格尺寸,自动算出价格,点击“应用价格”,价格就直接应用到项目中了,省去了翻找公式、敲计算器的时间。当然也可以点击“扫描件”,调出当期这些材料的计算公式。如果..._品茗计价中风口信息价换算在哪里
设计模式系列-第二章(设计原则-SOLID)_设计模式第二章完整代码-程序员宅基地
文章浏览阅读108次。前言:SOLID 原则并非单纯的 1 个原则,而是由 5 个设计原则组成的,它们分别是:单一职责原则、开闭原则、里式替换原则、接口隔离原则和依赖反转原则,依次对应 SOLID 中的 S、O、L、I、D 这 5 个英文字母。一、单一职责原则(SRP) 单一职责原则的英文是 Single Responsibility Principle,缩写为 SRP。一个类或者模块只负责完成一个职责(或者功能)。单一职责原则是为了实现代码高内聚、低耦合,提高代码的复用性、可读性、可维护性。单一职责原则通过..._设计模式第二章完整代码
mysql-workbench双击后无法启动解决方案_workbench双击无反应-程序员宅基地
文章浏览阅读3.3k次,点赞2次,收藏8次。好久没更新了 这个问题我遇到了两次,一次是腾讯云服务器上,一次是我的电脑上,都是安装后点mysql-workbench没有任何反应。网上别的解决方案我就不说了,要是好使你们也不会找到这里。**很简单!你们首先去mysql-workbench得安装目的地哪里,找到这个东西**双击它!看看是不是这个结果然后去下载这个.dll文件之后把这个文件放到C:\Windows\System32 ..._workbench双击无反应