3D目标检测数据集 KITTI(标签格式解析、3D框可视化、点云转图像、BEV鸟瞰图)-程序员宅基地
技术标签: 可视化 点云转图像 KITTI 单目3D目标检测 标签格式 3D目标检测
本文介绍在3D目标检测中,理解和使用KITTI 数据集,包括KITTI 的基本情况、下载数据集、标签格式解析、3D框可视化、点云转图像、画BEV鸟瞰图等,并配有实现代码。
目录
1、KITTI数据集3D框可视化
2、KITTI 3D数据集
kitti 3D数据集的基本情况:

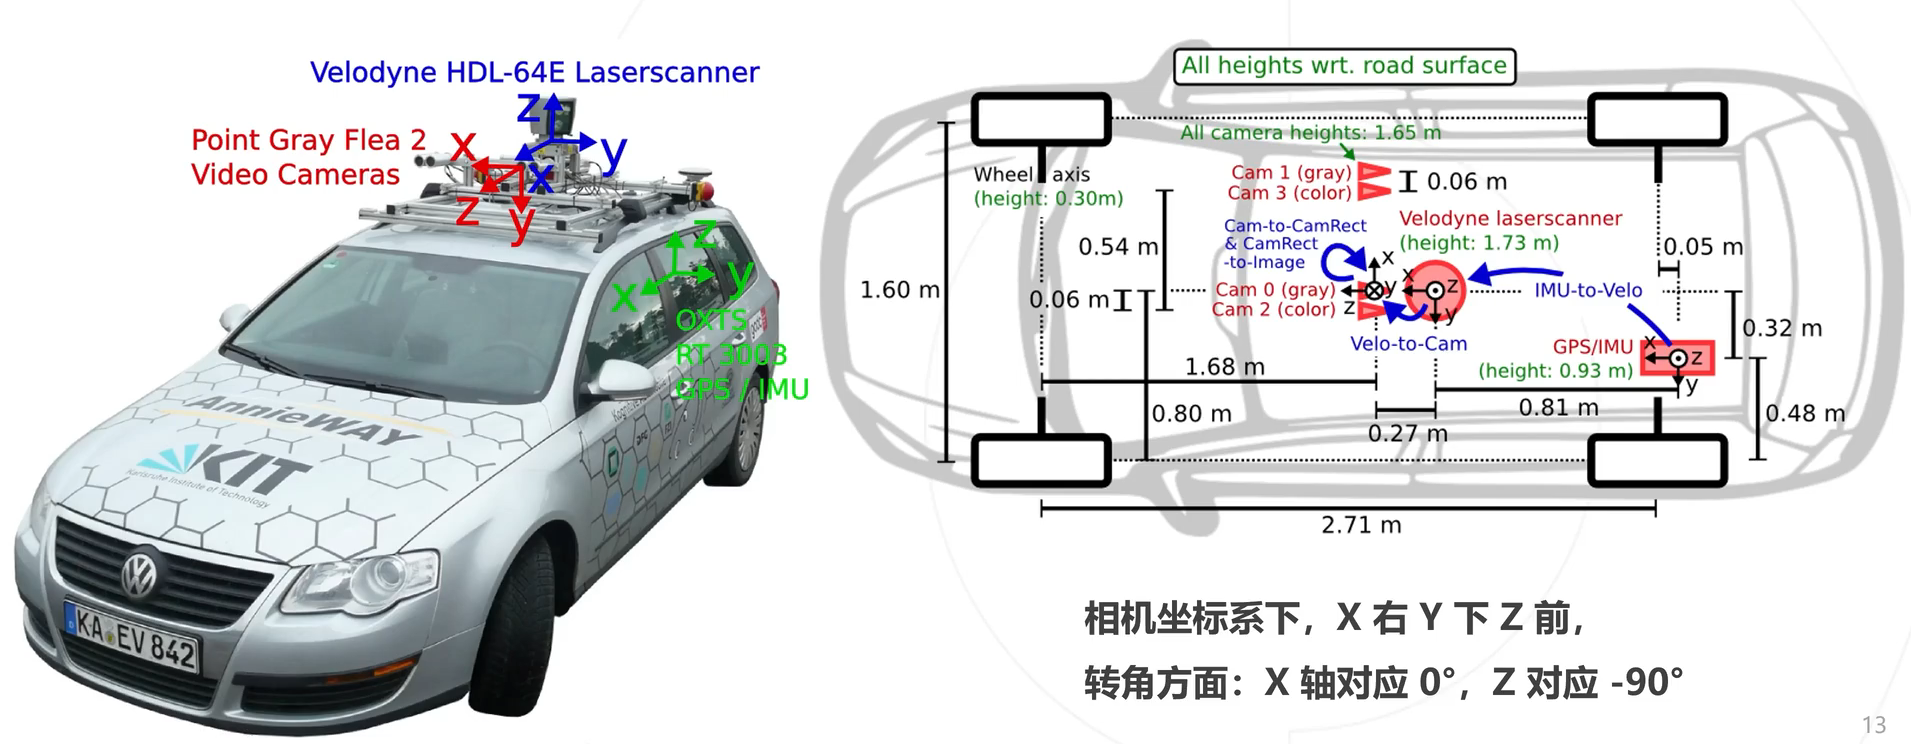
KITTI整个数据集是在德国卡尔斯鲁厄采集的,采集时长6小时。KITTI官网放出的数据大约占采集全部的25%,去除了测试集中相关的数据片段,按场景可以分为“道路”、“城市”、“住宅区”、“校园”和“行人”5类。
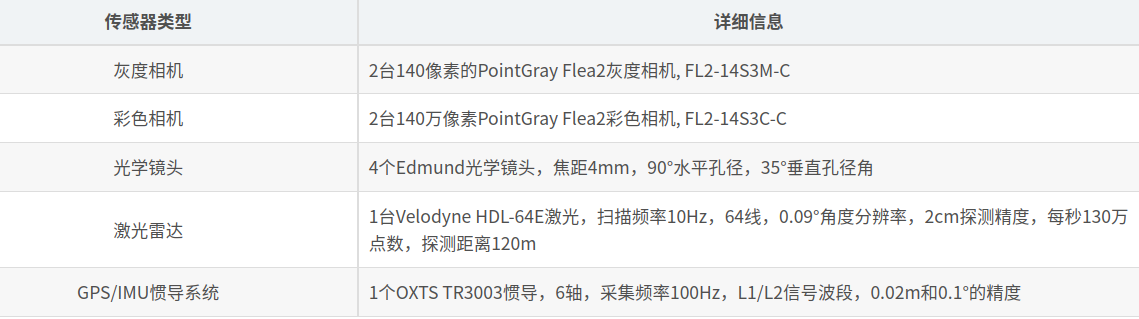
传感器配置:
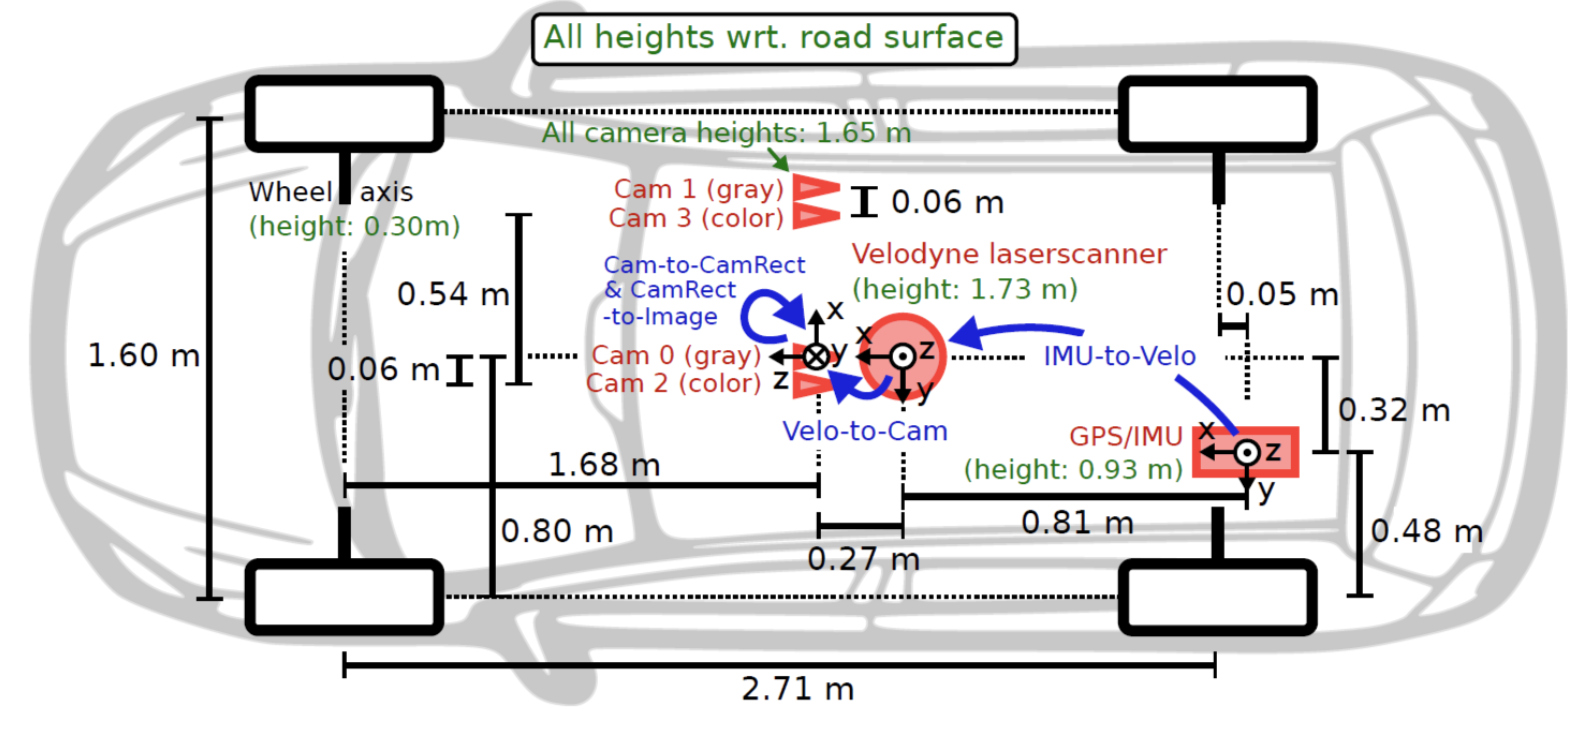
传感器安装位置:
3、下载数据集
The KITTI Vision Benchmark Suite (cvlibs.net)

下载数据需要注册账号的,获取取百度网盘下载;文件的格式如下所示
图片格式:xxx.jpg
点云格式:xxx.bin(点云是以bin二进制的方式存储的)
标定参数:xxx.txt(一个文件中包括各个相机的内参、畸变校正矩阵、激光雷达坐标转到相机坐标的矩阵、IMU坐标转到激光雷达坐标的矩阵)
标签格式:xxx.txt(包含类别、截断情况、遮挡情况、观测角度、2D框左上角坐标、2D框右下角坐标、3D物体的尺寸-高宽长、3D物体的中心坐标-xyz、置信度)
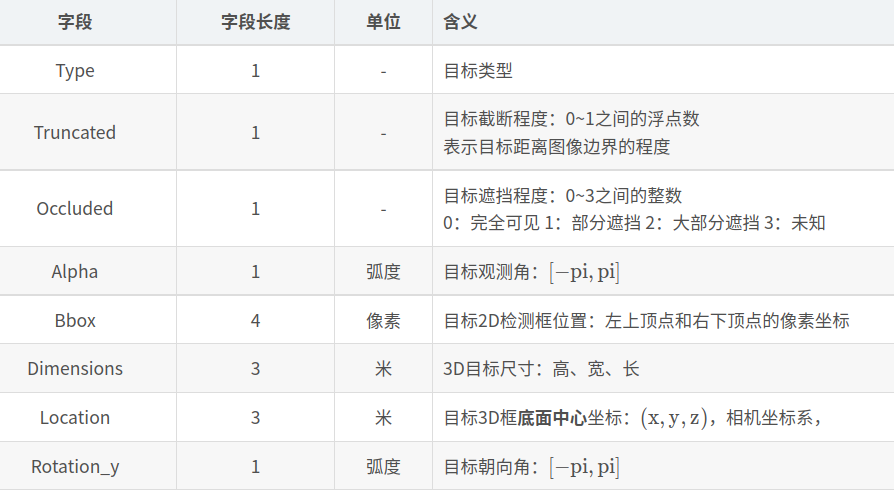
4、标签格式
示例标签:Pedestrian 0.00 0 -0.20 712.40 143.00 810.73 307.92 1.89 0.48 1.20 1.84 1.47 8.41 0.01

这时可以看看这个视频:
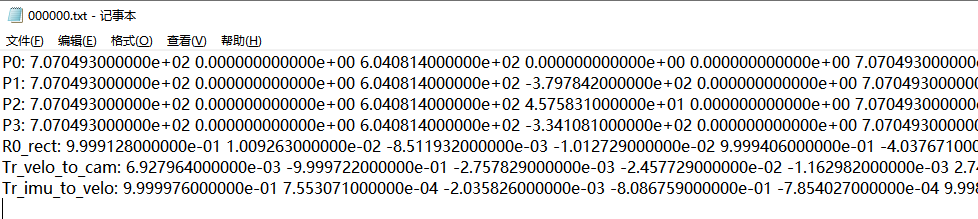
5、标定参数解析
然后看一下标定参数:
P0-P3:是各个相机的内参矩阵;3×4的相机投影矩阵,0~3分别对应左侧灰度相机、右侧灰度相机、左侧彩色相机、右侧彩色相机。
R0_rect: 是左相机的畸变矫正矩阵;3×3的旋转修正矩阵。
Tr_velo_to_cam:是激光雷达坐标系 转到 相机坐标系矩阵;3×4的激光坐标系到Cam 0坐标系的变换矩阵。
Tr_imu_to_velo: 是IMU坐标转到激光雷达坐标的矩阵;3×4的IMU坐标系到激光坐标系的变换矩阵。
6、点云数据-->投影到图像
当有了点云数据信息,如何投影到图像中呢?本质上是一个坐标系转换的问题,流程思路如下:
- 已知点云坐标(x,y,z),当前是处于激光雷达坐标系
- 激光雷达坐标系 转到 相机坐标系,需要用到标定参数中的Tr_velo_to_cam矩阵,此时得到相机坐标(x1,y1,z1)
- 相机坐标系进行畸变矫正,需要用到标定参数中的R0_rect矩阵,此时得到相机坐标(x2,y2,z2)
- 相机坐标系转为图像坐标系,需要用到标定参数中的P0矩阵,即相机内存矩阵,此时得到图像坐标(u,v)
看一下示例效果:

接口代码:
'''
将点云数据投影到图像
'''
def show_lidar_on_image(pc_velo, img, calib, img_width, img_height):
    ''' Project LiDAR points to image '''
    imgfov_pc_velo, pts_2d, fov_inds = get_lidar_in_image_fov(pc_velo,
        calib, 0, 0, img_width, img_height, True)
    imgfov_pts_2d = pts_2d[fov_inds,:]
    imgfov_pc_rect = calib.project_velo_to_rect(imgfov_pc_velo)

    import matplotlib.pyplot as plt
    cmap = plt.cm.get_cmap('hsv', 256)
    cmap = np.array([cmap(i) for i in range(256)])[:,:3]*255

    for i in range(imgfov_pts_2d.shape[0]):
        depth = imgfov_pc_rect[i,2]
        color = cmap[int(640.0/depth),:]
        cv2.circle(img, (int(np.round(imgfov_pts_2d[i,0])),
            int(np.round(imgfov_pts_2d[i,1]))),
            2, color=tuple(color), thickness=-1)
    Image.fromarray(img).save('save_output/lidar_on_image.png')
    Image.fromarray(img).show()
    return img
核心代码:
'''
将点云数据投影到相机坐标系
'''
def get_lidar_in_image_fov(pc_velo, calib, xmin, ymin, xmax, ymax,
                           return_more=False, clip_distance=2.0):
    ''' Filter lidar points, keep those in image FOV '''
    pts_2d = calib.project_velo_to_image(pc_velo)
    fov_inds = (pts_2d[:,0]<xmax) & (pts_2d[:,0]>=xmin) & \
        (pts_2d[:,1]<ymax) & (pts_2d[:,1]>=ymin)
    fov_inds = fov_inds & (pc_velo[:,0]>clip_distance)
    imgfov_pc_velo = pc_velo[fov_inds,:]
    if return_more:
        return imgfov_pc_velo, pts_2d, fov_inds
    else:
        return imgfov_pc_velo
7、图像数据-->投影到点云
当有了图像RGB信息,如何投影到点云中呢?本质上是一个坐标系转换的问题,和上面的是逆过程,流程思路如下:
- 已知图像坐标(u,v),当前是处于图像坐标系
- 图像坐标系 转 相机坐标系,需要用到标定参数中的P0逆矩阵,即相机内存矩阵,得到相机坐标(x,y,z)
- 相机坐标系进行畸变矫正,需要用到标定参数中的R0_rect逆矩阵,得到相机坐标(x1,y1,z1)
- 矫正后相机坐标系 转 激光雷达坐标系,需要用到标定参数中的Tr_velo_to_cam逆矩阵,此时得到激光雷达坐标(x2,y2,z2)
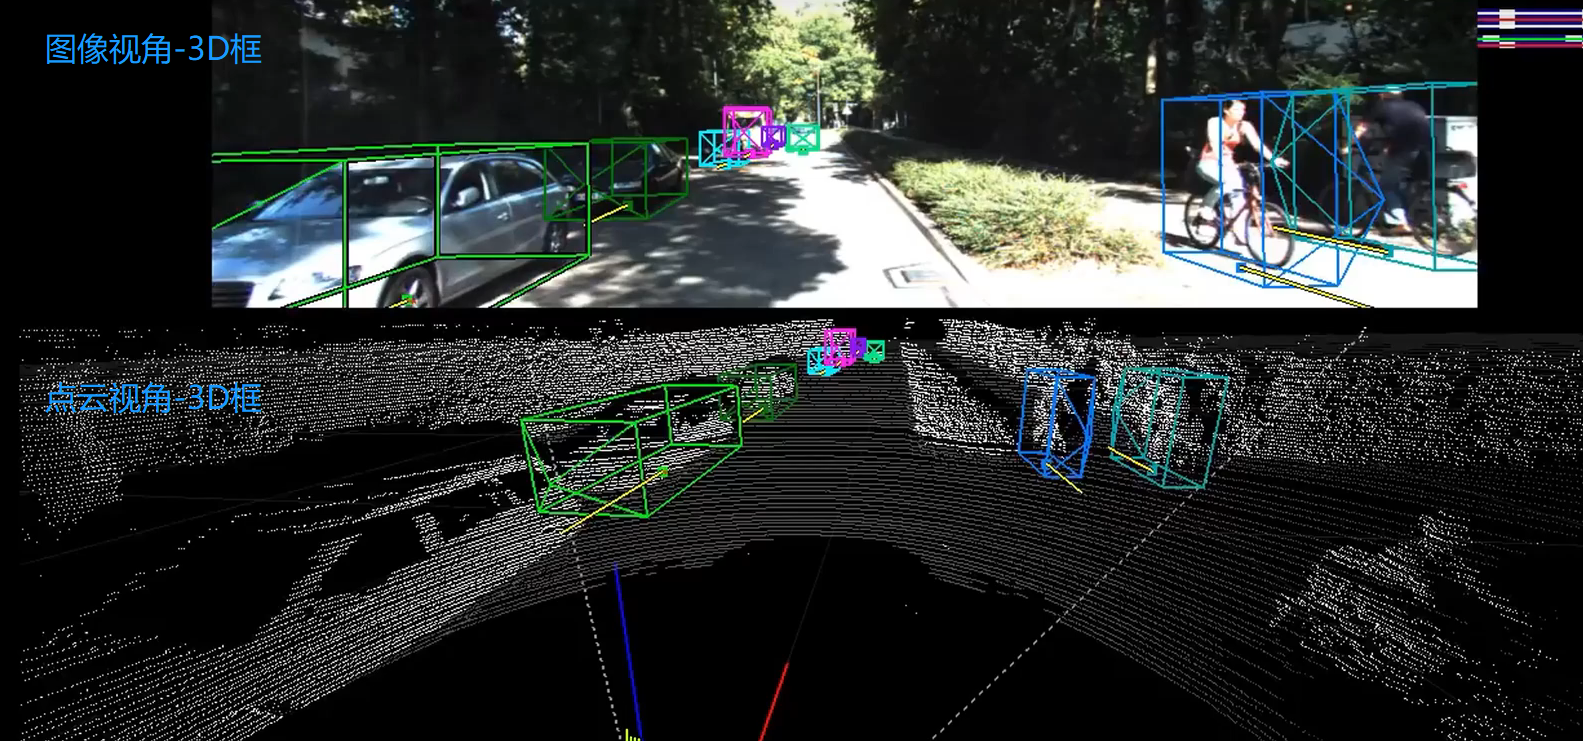
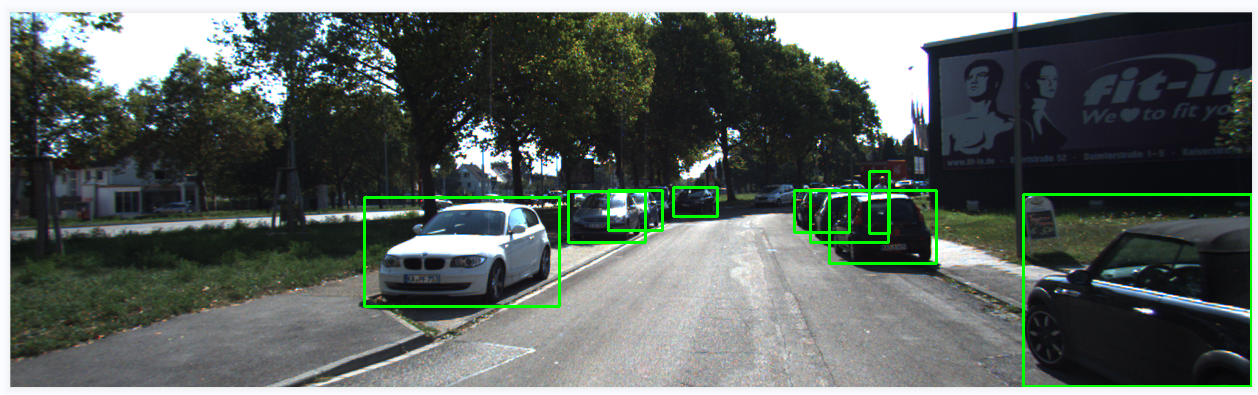
8、可视化图像2D结果、3D结果
先看一下2D框的效果:
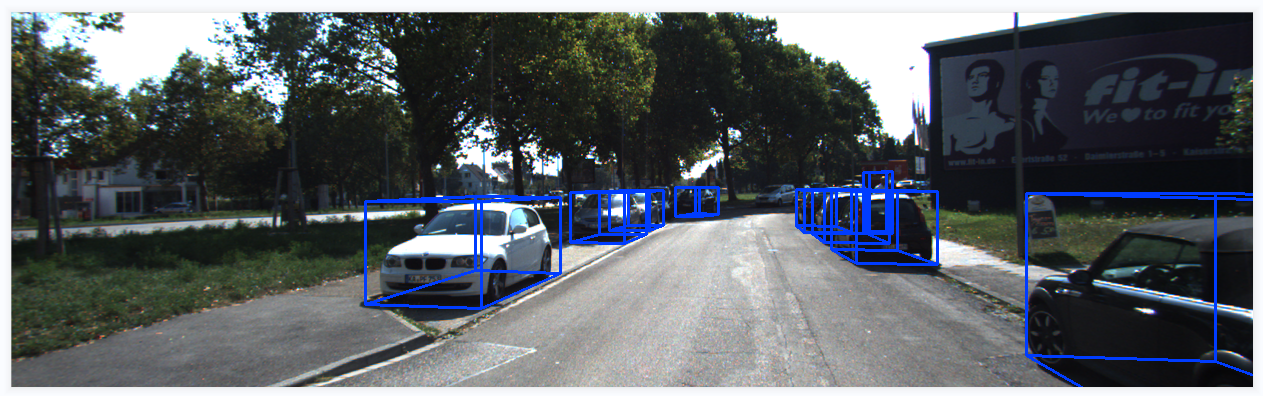
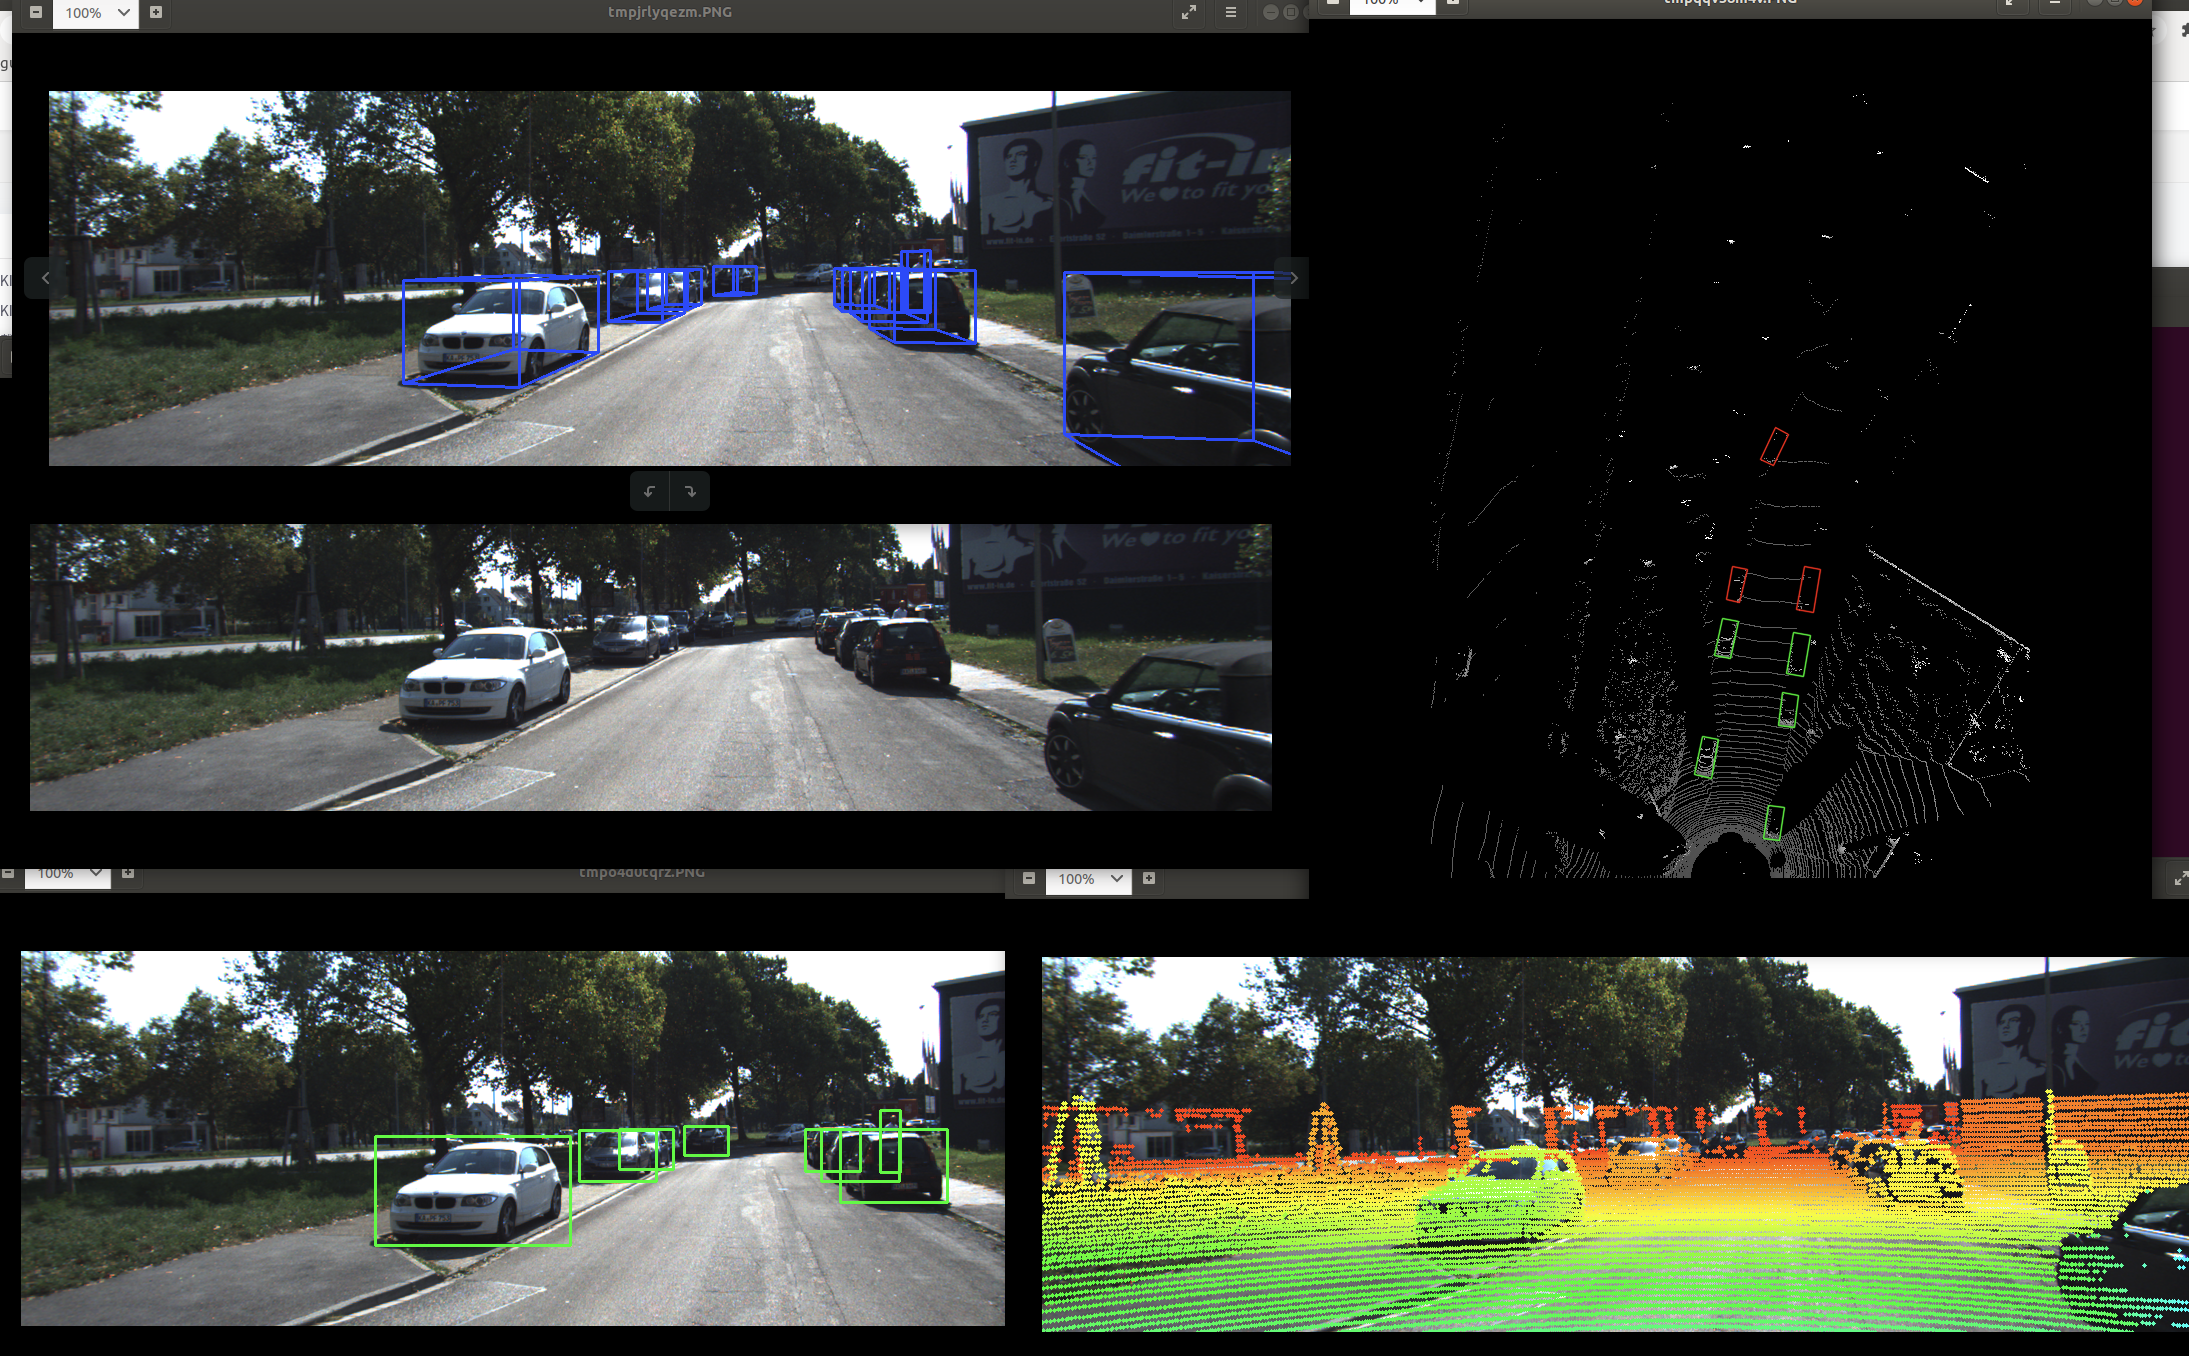
3D框的效果:
接口代码:
'''
在图像中画2D框、3D框
'''
def show_image_with_boxes(img, objects, calib, show3d=True):
    img1 = np.copy(img) # for 2d bbox
    img2 = np.copy(img) # for 3d bbox
    for obj in objects:
        if obj.type=='DontCare':continue
        cv2.rectangle(img1, (int(obj.xmin),int(obj.ymin)), (int(obj.xmax),int(obj.ymax)), (0,255,0), 2) # 画2D框
        box3d_pts_2d, box3d_pts_3d = utils.compute_box_3d(obj, calib.P) # 获取图像3D框(8*2)、相机坐标系3D框(8*3)
        img2 = utils.draw_projected_box3d(img2, box3d_pts_2d) # 在图像上画3D框
    if show3d:
        Image.fromarray(img2).save('save_output/image_with_3Dboxes.png')
        Image.fromarray(img2).show()
    else:
        Image.fromarray(img1).save('save_output/image_with_2Dboxes.png')
        Image.fromarray(img1).show()
核心代码:
def compute_box_3d(obj, P):
'''
计算对象的3D边界框在图像平面上的投影
输入: obj代表一个物体标签信息, P代表相机的投影矩阵-内参。
输出: 返回两个值, corners_3d表示3D边界框在 相机坐标系 的8个角点的坐标-3D坐标。
corners_2d表示3D边界框在 图像上 的8个角点的坐标-2D坐标。
'''
# 计算一个绕Y轴旋转的旋转矩阵R,用于将3D坐标从世界坐标系转换到相机坐标系。obj.ry是对象的偏航角
R = roty(obj.ry)
# 物体实际的长、宽、高
l = obj.l;
w = obj.w;
h = obj.h;
# 存储了3D边界框的8个角点相对于对象中心的坐标。这些坐标定义了3D边界框的形状。
x_corners = [l/2,l/2,-l/2,-l/2,l/2,l/2,-l/2,-l/2];
y_corners = [0,0,0,0,-h,-h,-h,-h];
z_corners = [w/2,-w/2,-w/2,w/2,w/2,-w/2,-w/2,w/2];
# 1、将3D边界框的角点坐标从对象坐标系转换到相机坐标系。它使用了旋转矩阵R
corners_3d = np.dot(R, np.vstack([x_corners,y_corners,z_corners]))
# 3D边界框的坐标进行平移
corners_3d[0,:] = corners_3d[0,:] + obj.t[0];
corners_3d[1,:] = corners_3d[1,:] + obj.t[1];
corners_3d[2,:] = corners_3d[2,:] + obj.t[2];
# 2、检查对象是否在相机前方,因为只有在相机前方的对象才会被绘制。
# 如果对象的Z坐标(深度)小于0.1,就意味着对象在相机后方,那么corners_2d将被设置为None,函数将返回None。
if np.any(corners_3d[2,:]<0.1):
corners_2d = None
return corners_2d, np.transpose(corners_3d)
# 3、将相机坐标系下的3D边界框的角点,投影到图像平面上,得到它们在图像上的2D坐标。
corners_2d = project_to_image(np.transpose(corners_3d), P);
return corners_2d, np.transpose(corners_3d)
def draw_projected_box3d(image, qs, color=(0,60,255), thickness=2):
'''
qs: 包含8个3D边界框角点坐标的数组, 形状为(8, 2)。图像坐标下的3D框, 8个顶点坐标。
'''
''' Draw 3d bounding box in image
qs: (8,2) array of vertices for the 3d box in following order:
1 -------- 0
/| /|
2 -------- 3 .
| | | |
. 5 -------- 4
|/ |/
6 -------- 7
'''
qs = qs.astype(np.int32) # 将输入的顶点坐标转换为整数类型,以便在图像上绘制。
# 这个循环迭代4次,每次处理一个边界框的一条边。
for k in range(0,4):
# Ref: http://docs.enthought.com/mayavi/mayavi/auto/mlab_helper_functions.html
# 定义了要绘制的边的起始点和结束点的索引。在这个循环中,它用于绘制边界框的前四条边。
i,j=k,(k+1)%4
cv2.line(image, (qs[i,0],qs[i,1]), (qs[j,0],qs[j,1]), color, thickness)
# 定义了要绘制的边的起始点和结束点的索引。在这个循环中,它用于绘制边界框的后四条边,与前四条边平行
i,j=k+4,(k+1)%4 + 4
cv2.line(image, (qs[i,0],qs[i,1]), (qs[j,0],qs[j,1]), color, thickness)
# 定义了要绘制的边的起始点和结束点的索引。在这个循环中,它用于绘制连接前四条边和后四条边的边界框的边。
i,j=k,k+4
cv2.line(image, (qs[i,0],qs[i,1]), (qs[j,0],qs[j,1]), color, thickness)
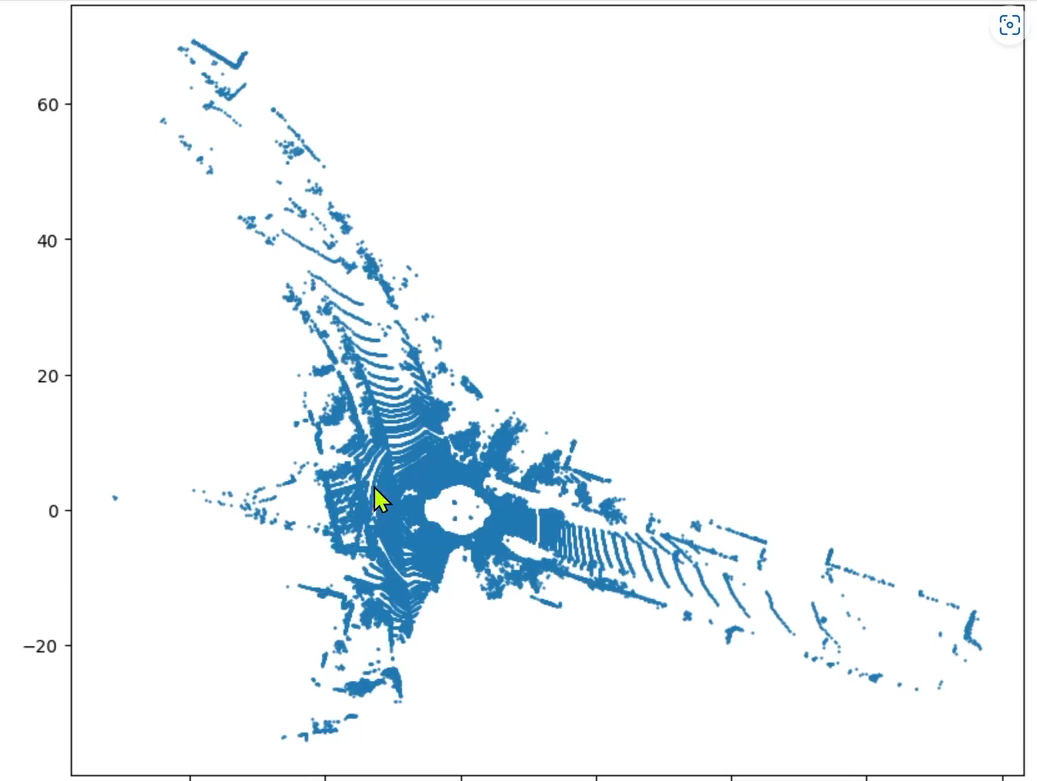
return image9、点云3D结果-->图像BEV鸟瞰图结果(坐标系转换)
思路流程:
- 读取点云数据,点云得存储格式是n*4,n是指当前文件点云的数量,4分别表示(x,y,z,intensity),即点云的空间三维坐标、反射强度
- 我们只需读取前两行即可,得到坐标点(x,y)
- 然后将坐标点(x,y),画散点图
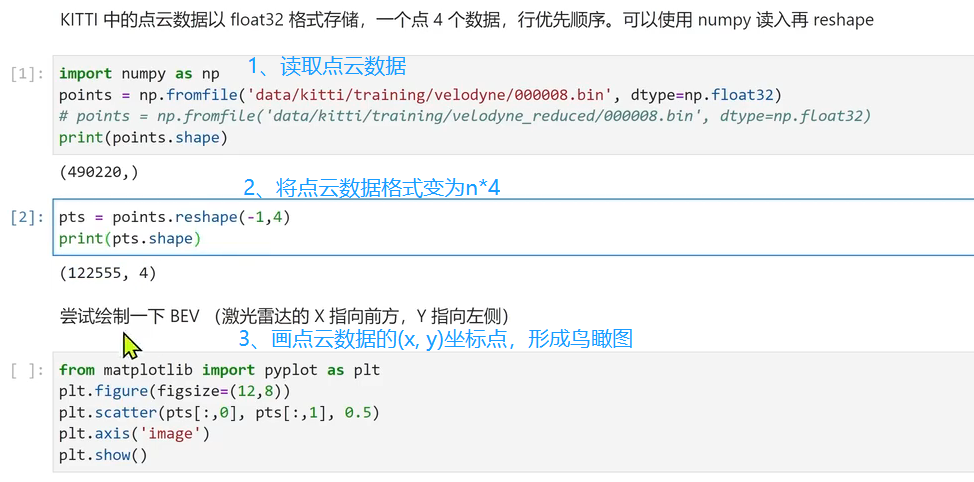
BEV鸟瞰图效果如下:
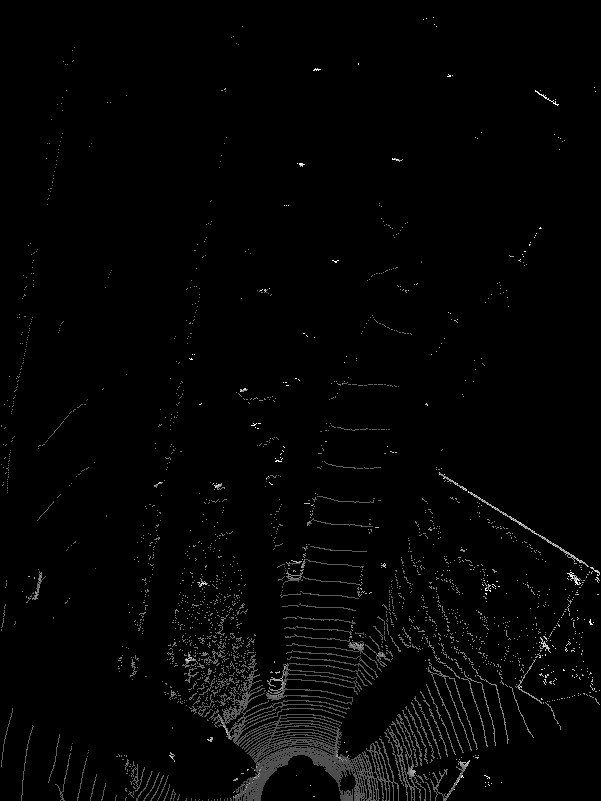
10、绘制BEV鸟瞰图
BEV图像示例效果:
核心代码:
'''
可视化BEV鸟瞰图
'''
def show_lidar_topview(pc_velo, objects, calib):
      # 1-设置鸟瞰图范围
    side_range = (-30, 30)  # 左右距离
    fwd_range = (0, 80)  # 后前距离

    x_points = pc_velo[:, 0]
    y_points = pc_velo[:, 1]
    z_points = pc_velo[:, 2]

    # 2-获得区域内的点
    f_filt = np.logical_and(x_points > fwd_range[0], x_points < fwd_range[1])
    s_filt = np.logical_and(y_points > side_range[0], y_points < side_range[1])
    filter = np.logical_and(f_filt, s_filt)
    indices = np.argwhere(filter).flatten()
    x_points = x_points[indices]
    y_points = y_points[indices]
    z_points = z_points[indices]

    # 定义了鸟瞰图中每个像素代表的距离
    res = 0.1
    # 3-1将点云坐标系 转到 BEV坐标系
    x_img = (-y_points / res).astype(np.int32)
    y_img = (-x_points / res).astype(np.int32)
    # 3-2调整坐标原点
    x_img -= int(np.floor(side_range[0]) / res)
    y_img += int(np.floor(fwd_range[1]) / res)
    print(x_img.min(), x_img.max(), y_img.min(), y_img.max())

    # 4-填充像素值, 将点云数据的高度信息(Z坐标)映射到像素值
    height_range = (-3, 1.0)
    pixel_value = np.clip(a=z_points, a_max=height_range[1], a_min=height_range[0])


    def scale_to_255(a, min, max, dtype=np.uint8):
        return ((a - min) / float(max - min) * 255).astype(dtype)

    pixel_value = scale_to_255(pixel_value, height_range[0], height_range[1])

    # 创建图像数组
    x_max = 1 + int((side_range[1] - side_range[0]) / res)
    y_max = 1 + int((fwd_range[1] - fwd_range[0]) / res)
    im = np.zeros([y_max, x_max], dtype=np.uint8)
    im[y_img, x_img] = pixel_value

    im2 = Image.fromarray(im)
    im2.save('save_output/BEV.png')
    im2.show()
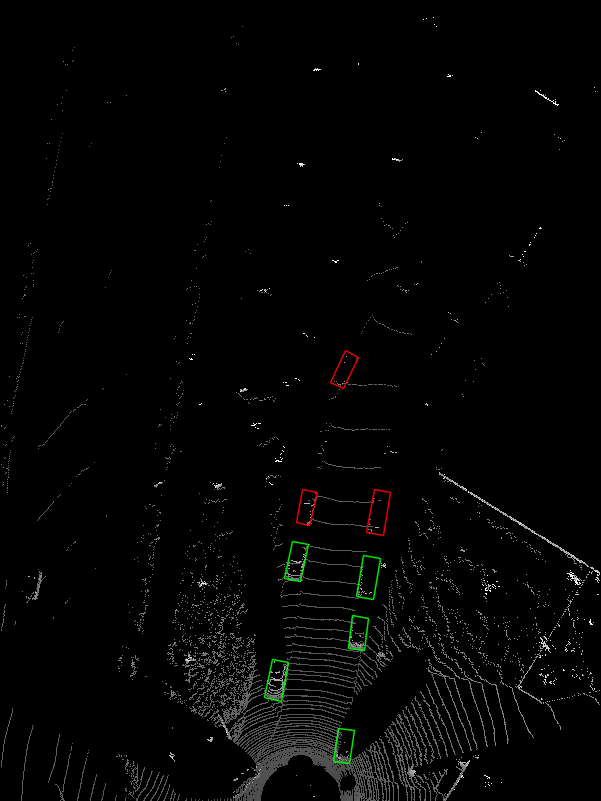
11、BEV鸟瞰图画2d框
在BEV视图中画框,可视化结果:
接口代码:
'''
将点云数据3D框投影到BEV
'''
def show_lidar_topview_with_boxes(img, objects, calib):
    def bbox3d(obj):
        box3d_pts_2d, box3d_pts_3d = utils.compute_box_3d(obj, calib.P) # 获取3D框-图像、3D框-相机坐标系
        box3d_pts_3d_velo = calib.project_rect_to_velo(box3d_pts_3d) # 将相机坐标系的框 转到 激光雷达坐标系
        return box3d_pts_3d_velo # 返回nx3的点

    boxes3d = [bbox3d(obj) for obj in objects if obj.type == "Car"]
    gt = np.array(boxes3d)
    im2 = utils.draw_box3d_label_on_bev(img, gt, scores=None, thickness=1) # 获取激光雷达坐标系的3D点,选择x, y两维,画到BEV平面坐标系上
    im2 = Image.fromarray(im2)
    im2.save('save_output/BEV with boxes.png')
    im2.show()
核心代码:
# 设置BEV鸟瞰图参数
side_range = (-30, 30)  # 左右距离
fwd_range = (0, 80)  # 后前距离
res = 0.1  # 分辨率0.05m

def compute_box_3d(obj, P):
    '''
    计算对象的3D边界框在图像平面上的投影
    输入: obj代表一个物体标签信息,  P代表相机的投影矩阵-内参。
    输出: 返回两个值, corners_3d表示3D边界框在 相机坐标系 的8个角点的坐标-3D坐标。
                                     corners_2d表示3D边界框在 图像上 的8个角点的坐标-2D坐标。
    '''
    # 计算一个绕Y轴旋转的旋转矩阵R,用于将3D坐标从世界坐标系转换到相机坐标系。obj.ry是对象的偏航角
    R = roty(obj.ry)

    # 物体实际的长、宽、高
    l = obj.l;
    w = obj.w;
    h = obj.h;

    # 存储了3D边界框的8个角点相对于对象中心的坐标。这些坐标定义了3D边界框的形状。
    x_corners = [l/2,l/2,-l/2,-l/2,l/2,l/2,-l/2,-l/2];
    y_corners = [0,0,0,0,-h,-h,-h,-h];
    z_corners = [w/2,-w/2,-w/2,w/2,w/2,-w/2,-w/2,w/2];

    # 1、将3D边界框的角点坐标从对象坐标系转换到相机坐标系。它使用了旋转矩阵R
    corners_3d = np.dot(R, np.vstack([x_corners,y_corners,z_corners]))
    # 3D边界框的坐标进行平移
    corners_3d[0,:] = corners_3d[0,:] + obj.t[0];
    corners_3d[1,:] = corners_3d[1,:] + obj.t[1];
    corners_3d[2,:] = corners_3d[2,:] + obj.t[2];

    # 2、检查对象是否在相机前方,因为只有在相机前方的对象才会被绘制。
    # 如果对象的Z坐标(深度)小于0.1,就意味着对象在相机后方,那么corners_2d将被设置为None,函数将返回None。
    if np.any(corners_3d[2,:]<0.1):
        corners_2d = None
        return corners_2d, np.transpose(corners_3d)

    # 3、将相机坐标系下的3D边界框的角点,投影到图像平面上,得到它们在图像上的2D坐标。
    corners_2d = project_to_image(np.transpose(corners_3d), P);
    return corners_2d, np.transpose(corners_3d)
12、完整工程代码
工程目录:

kitti_vis_main.py(主代码入口)
from __future__ import print_function

import os
import sys
import cv2
import os.path
from PIL import Image
BASE_DIR = os.path.dirname(os.path.abspath(__file__))
ROOT_DIR = os.path.dirname(BASE_DIR)
sys.path.append(BASE_DIR)
sys.path.append(os.path.join(ROOT_DIR, 'mayavi'))
from kitti_object import *


def visualization():
    import mayavi.mlab as mlab
    dataset = kitti_object(os.path.join(ROOT_DIR, 'Kitti_3D_Vis/dataset/object'))   # linux 路径
    data_idx = 10               # 选择第几张图像

    # 1-加载标签数据
    objects = dataset.get_label_objects(data_idx)
    print("There are %d objects.", len(objects))

    # 2-加载图像
    img = dataset.get_image(data_idx)
    img = cv2.cvtColor(img, cv2.COLOR_BGR2RGB)
    img_height, img_width, img_channel = img.shape

    # 3-加载点云数据
    pc_velo = dataset.get_lidar(data_idx)[:,0:3] # (x, y, z)

    # 4-加载标定参数
    calib = dataset.get_calibration(data_idx)

    # 5-可视化原始图像
    print(' ------------ show raw image -------- ')
    Image.fromarray(img).show()

    # 6-在图像中画2D框
    print(' ------------ show image with 2D bounding box -------- ')
    show_image_with_boxes(img, objects, calib, False)

    # 7-在图像中画3D框
    print(' ------------ show image with 3D bounding box ------- ')
    show_image_with_boxes(img, objects, calib, True)

    # 8-将点云数据投影到图像
    print(' ----------- LiDAR points projected to image plane -- ')
    show_lidar_on_image(pc_velo, img, calib, img_width, img_height)

    # 9-画BEV图
    print('------------------ BEV of LiDAR points -----------------------------')
    show_lidar_topview(pc_velo, objects, calib)

     # 10-在BEV图中画2D框
    print('--------------- BEV of LiDAR points with bobes ---------------------')
    img1 = cv2.imread('save_output/BEV.png')
    img = cv2.cvtColor(img1, cv2.COLOR_BGR2RGB)
    show_lidar_topview_with_boxes(img1, objects, calib)


if __name__=='__main__':
    visualization()
kitti_util.py
from __future__ import print_function

import numpy as np
import cv2
from PIL import Image
import os

# 设置BEV鸟瞰图参数
side_range = (-30, 30)  # 左右距离
fwd_range = (0, 80)  # 后前距离
res = 0.1  # 分辨率0.05m

def compute_box_3d(obj, P):
    '''
    计算对象的3D边界框在图像平面上的投影
    输入: obj代表一个物体标签信息,  P代表相机的投影矩阵-内参。
    输出: 返回两个值, corners_3d表示3D边界框在 相机坐标系 的8个角点的坐标-3D坐标。
                                     corners_2d表示3D边界框在 图像上 的8个角点的坐标-2D坐标。
    '''
    # 计算一个绕Y轴旋转的旋转矩阵R,用于将3D坐标从世界坐标系转换到相机坐标系。obj.ry是对象的偏航角
    R = roty(obj.ry)

    # 物体实际的长、宽、高
    l = obj.l;
    w = obj.w;
    h = obj.h;

    # 存储了3D边界框的8个角点相对于对象中心的坐标。这些坐标定义了3D边界框的形状。
    x_corners = [l/2,l/2,-l/2,-l/2,l/2,l/2,-l/2,-l/2];
    y_corners = [0,0,0,0,-h,-h,-h,-h];
    z_corners = [w/2,-w/2,-w/2,w/2,w/2,-w/2,-w/2,w/2];

    # 1、将3D边界框的角点坐标从对象坐标系转换到相机坐标系。它使用了旋转矩阵R
    corners_3d = np.dot(R, np.vstack([x_corners,y_corners,z_corners]))
    # 3D边界框的坐标进行平移
    corners_3d[0,:] = corners_3d[0,:] + obj.t[0];
    corners_3d[1,:] = corners_3d[1,:] + obj.t[1];
    corners_3d[2,:] = corners_3d[2,:] + obj.t[2];

    # 2、检查对象是否在相机前方,因为只有在相机前方的对象才会被绘制。
    # 如果对象的Z坐标(深度)小于0.1,就意味着对象在相机后方,那么corners_2d将被设置为None,函数将返回None。
    if np.any(corners_3d[2,:]<0.1):
        corners_2d = None
        return corners_2d, np.transpose(corners_3d)

    # 3、将相机坐标系下的3D边界框的角点,投影到图像平面上,得到它们在图像上的2D坐标。
    corners_2d = project_to_image(np.transpose(corners_3d), P);
    return corners_2d, np.transpose(corners_3d)


def project_to_image(pts_3d, P):
    '''
    将相机坐标系下的3D边界框的角点, 投影到图像平面上, 得到它们在图像上的2D坐标
    输入: pts_3d是一个nx3的矩阵, 包含了待投影的3D坐标点(每行一个点), P是相机的投影矩阵, 通常是一个3x4的矩阵。
    输出: 返回一个nx2的矩阵, 包含了投影到图像平面上的2D坐标点。

      P(3x4) dot pts_3d_extended(4xn) = projected_pts_2d(3xn)  => normalize projected_pts_2d(2xn)
      <=> pts_3d_extended(nx4) dot P'(4x3) = projected_pts_2d(nx3)   => normalize projected_pts_2d(nx2)
    '''
    n = pts_3d.shape[0] # 获取3D点的数量
    pts_3d_extend = np.hstack((pts_3d, np.ones((n,1)))) # 将每个3D点的坐标扩展为齐次坐标形式(4D),通过在每个点的末尾添加1,创建了一个nx4的矩阵。
    pts_2d = np.dot(pts_3d_extend, np.transpose(P)) # 将扩展的3D坐标点矩阵与投影矩阵P相乘,得到一个nx3的矩阵,其中每一行包含了3D点在图像平面上的投影坐标。每个点的坐标表示为[x, y, z]。
    pts_2d[:,0] /= pts_2d[:,2] # 将投影坐标中的x坐标除以z坐标,从而获得2D图像上的x坐标。
    pts_2d[:,1] /= pts_2d[:,2] # 将投影坐标中的y坐标除以z坐标,从而获得2D图像上的y坐标。
    return pts_2d[:,0:2] # 返回一个nx2的矩阵,其中包含了每个3D点在2D图像上的坐标。


def draw_projected_box3d(image, qs, color=(0,60,255), thickness=2):
    '''
    qs: 包含8个3D边界框角点坐标的数组, 形状为(8, 2)。图像坐标下的3D框, 8个顶点坐标。
    '''
    ''' Draw 3d bounding box in image
        qs: (8,2) array of vertices for the 3d box in following order:
            1 -------- 0
           /|         /|
          2 -------- 3 .
          | |        | |
          . 5 -------- 4
          |/         |/
          6 -------- 7
    '''
    qs = qs.astype(np.int32) # 将输入的顶点坐标转换为整数类型,以便在图像上绘制。

    # 这个循环迭代4次,每次处理一个边界框的一条边。
    for k in range(0,4):
       # Ref: http://docs.enthought.com/mayavi/mayavi/auto/mlab_helper_functions.html

       # 定义了要绘制的边的起始点和结束点的索引。在这个循环中,它用于绘制边界框的前四条边。
       i,j=k,(k+1)%4
       cv2.line(image, (qs[i,0],qs[i,1]), (qs[j,0],qs[j,1]), color, thickness)

        # 定义了要绘制的边的起始点和结束点的索引。在这个循环中,它用于绘制边界框的后四条边,与前四条边平行
       i,j=k+4,(k+1)%4 + 4
       cv2.line(image, (qs[i,0],qs[i,1]), (qs[j,0],qs[j,1]), color, thickness)

        # 定义了要绘制的边的起始点和结束点的索引。在这个循环中,它用于绘制连接前四条边和后四条边的边界框的边。
       i,j=k,k+4
       cv2.line(image, (qs[i,0],qs[i,1]), (qs[j,0],qs[j,1]), color, thickness)
    return image

def draw_box3d_label_on_bev(image, boxes3d, thickness=1, scores=None):
    # if scores is not None and scores.shape[0] >0:
    img = image.copy()
    num = len(boxes3d)
    for n in range(num):
        b = boxes3d[n]
        x0 = b[0, 0]
        y0 = b[0, 1]
        x1 = b[1, 0]
        y1 = b[1, 1]
        x2 = b[2, 0]
        y2 = b[2, 1]
        x3 = b[3, 0]
        y3 = b[3, 1]
        if (x0<30 and x1<30 and x2<30 and x3<30):
            u0, v0 = lidar_to_top_coords(x0, y0)
            u1, v1 = lidar_to_top_coords(x1, y1)
            u2, v2 = lidar_to_top_coords(x2, y2)
            u3, v3 = lidar_to_top_coords(x3, y3)
            color = (0, 255, 0) # green
            cv2.line(img, (u0, v0), (u1, v1), color, thickness, cv2.LINE_AA)
            cv2.line(img, (u1, v1), (u2, v2), color, thickness, cv2.LINE_AA)
            cv2.line(img, (u2, v2), (u3, v3), color, thickness, cv2.LINE_AA)
            cv2.line(img, (u3, v3), (u0, v0), color, thickness, cv2.LINE_AA)
        elif (x0<50 and x1<50 and x2<50 and x3<50):
            color = (255, 0, 0) # red
            u0, v0 = lidar_to_top_coords(x0, y0)
            u1, v1 = lidar_to_top_coords(x1, y1)
            u2, v2 = lidar_to_top_coords(x2, y2)
            u3, v3 = lidar_to_top_coords(x3, y3)
            cv2.line(img, (u0, v0), (u1, v1), color, thickness, cv2.LINE_AA)
            cv2.line(img, (u1, v1), (u2, v2), color, thickness, cv2.LINE_AA)
            cv2.line(img, (u2, v2), (u3, v3), color, thickness, cv2.LINE_AA)
            cv2.line(img, (u3, v3), (u0, v0), color, thickness, cv2.LINE_AA)
        else:
            color = (0, 0, 255) # blue
            u0, v0 = lidar_to_top_coords(x0, y0)
            u1, v1 = lidar_to_top_coords(x1, y1)
            u2, v2 = lidar_to_top_coords(x2, y2)
            u3, v3 = lidar_to_top_coords(x3, y3)
            cv2.line(img, (u0, v0), (u1, v1), color, thickness, cv2.LINE_AA)
            cv2.line(img, (u1, v1), (u2, v2), color, thickness, cv2.LINE_AA)
            cv2.line(img, (u2, v2), (u3, v3), color, thickness, cv2.LINE_AA)
            cv2.line(img, (u3, v3), (u0, v0), color, thickness, cv2.LINE_AA)

    return img

def draw_box3d_predict_on_bev(image, boxes3d, thickness=1, scores=None):
     # if scores is not None and scores.shape[0] >0:
    img = image.copy()
    num = len(boxes3d)
    for n in range(num):
        b = boxes3d[n]
        x0 = b[0, 0]
        y0 = b[0, 1]
        x1 = b[1, 0]
        y1 = b[1, 1]
        x2 = b[2, 0]
        y2 = b[2, 1]
        x3 = b[3, 0]
        y3 = b[3, 1]
        color = (255, 255, 255) # white
        u0, v0 = lidar_to_top_coords(x0, y0)
        u1, v1 = lidar_to_top_coords(x1, y1)
        u2, v2 = lidar_to_top_coords(x2, y2)
        u3, v3 = lidar_to_top_coords(x3, y3)
        cv2.line(img, (u0, v0), (u1, v1), color, thickness, cv2.LINE_AA)
        cv2.line(img, (u1, v1), (u2, v2), color, thickness, cv2.LINE_AA)
        cv2.line(img, (u2, v2), (u3, v3), color, thickness, cv2.LINE_AA)
        cv2.line(img, (u3, v3), (u0, v0), color, thickness, cv2.LINE_AA)
    return img

def lidar_to_top_coords(x, y, z=None):
    if 0:
        return x, y
    else:
        # print("TOP_X_MAX-TOP_X_MIN:",TOP_X_MAX,TOP_X_MIN)
        xx = (-y / res).astype(np.int32)
        yy = (-x / res).astype(np.int32)
        # 调整坐标原点
        xx -= int(np.floor(side_range[0]) / res)
        yy += int(np.floor(fwd_range[1]) / res)
        return xx, yy


# 解析标签数据
class Object3d(object):
    ''' 3d object label '''
    def __init__(self, label_file_line):
        data = label_file_line.split(' ')
        data[1:] = [float(x) for x in data[1:]]

        # extract label, truncation, occlusion
        self.type = data[0] # 'Car', 'Pedestrian', ...
        self.truncation = data[1] # truncated pixel ratio [0..1]
        self.occlusion = int(data[2]) # 0=visible, 1=partly occluded, 2=fully occluded, 3=unknown
        self.alpha = data[3] # object observation angle [-pi..pi]

        # extract 2d bounding box in 0-based coordinates
        self.xmin = data[4] # left
        self.ymin = data[5] # top
        self.xmax = data[6] # right
        self.ymax = data[7] # bottom
        self.box2d = np.array([self.xmin,self.ymin,self.xmax,self.ymax])

        # extract 3d bounding box information
        self.h = data[8] # box height
        self.w = data[9] # box width
        self.l = data[10] # box length (in meters)
        self.t = (data[11],data[12],data[13]) # location (x,y,z) in camera coord.
        self.ry = data[14] # yaw angle (around Y-axis in camera coordinates) [-pi..pi]

    def print_object(self):
        print('Type, truncation, occlusion, alpha: %s, %d, %d, %f' % \
            (self.type, self.truncation, self.occlusion, self.alpha))
        print('2d bbox (x0,y0,x1,y1): %f, %f, %f, %f' % \
            (self.xmin, self.ymin, self.xmax, self.ymax))
        print('3d bbox h,w,l: %f, %f, %f' % \
            (self.h, self.w, self.l))
        print('3d bbox location, ry: (%f, %f, %f), %f' % \
            (self.t[0],self.t[1],self.t[2],self.ry))


class Calibration(object):
    ''' Calibration matrices and utils
        3d XYZ in <label>.txt are in rect camera coord.
        2d box xy are in image2 coord
        Points in <lidar>.bin are in Velodyne coord.

        y_image2 = P^2_rect * x_rect
        y_image2 = P^2_rect * R0_rect * Tr_velo_to_cam * x_velo
        x_ref = Tr_velo_to_cam * x_velo
        x_rect = R0_rect * x_ref

        P^2_rect = [f^2_u,  0,      c^2_u,  -f^2_u b^2_x;
                    0,      f^2_v,  c^2_v,  -f^2_v b^2_y;
                    0,      0,      1,      0]
                 = K * [1|t]

        image2 coord:
         ----> x-axis (u)
        |
        |
        v y-axis (v)

        velodyne coord:
        front x, left y, up z

        rect/ref camera coord:
        right x, down y, front z

        Ref (KITTI paper): http://www.cvlibs.net/publications/Geiger2013IJRR.pdf

        TODO(rqi): do matrix multiplication only once for each projection.
    '''
    def __init__(self, calib_filepath, from_video=False):
        if from_video:
            calibs = self.read_calib_from_video(calib_filepath)
        else:
            calibs = self.read_calib_file(calib_filepath)
        # Projection matrix from rect camera coord to image2 coord
        self.P = calibs['P2']
        self.P = np.reshape(self.P, [3,4])
        # Rigid transform from Velodyne coord to reference camera coord
        self.V2C = calibs['Tr_velo_to_cam']
        self.V2C = np.reshape(self.V2C, [3,4])
        self.C2V = inverse_rigid_trans(self.V2C)
        # Rotation from reference camera coord to rect camera coord
        self.R0 = calibs['R0_rect']
        self.R0 = np.reshape(self.R0,[3,3])

        # Camera intrinsics and extrinsics
        self.c_u = self.P[0,2]
        self.c_v = self.P[1,2]
        self.f_u = self.P[0,0]
        self.f_v = self.P[1,1]
        self.b_x = self.P[0,3]/(-self.f_u) # relative
        self.b_y = self.P[1,3]/(-self.f_v)

    def read_calib_file(self, filepath):
        ''' Read in a calibration file and parse into a dictionary.'''
        data = {}
        with open(filepath, 'r') as f:
            for line in f.readlines():
                line = line.rstrip()
                if len(line)==0: continue
                key, value = line.split(':', 1)
                # The only non-float values in these files are dates, which
                # we don't care about anyway
                try:
                    data[key] = np.array([float(x) for x in value.split()])
                except ValueError:
                    pass

        return data

    def read_calib_from_video(self, calib_root_dir):
        ''' Read calibration for camera 2 from video calib files.
            there are calib_cam_to_cam and calib_velo_to_cam under the calib_root_dir
        '''
        data = {}
        cam2cam = self.read_calib_file(os.path.join(calib_root_dir, 'calib_cam_to_cam.txt'))
        velo2cam = self.read_calib_file(os.path.join(calib_root_dir, 'calib_velo_to_cam.txt'))
        Tr_velo_to_cam = np.zeros((3,4))
        Tr_velo_to_cam[0:3,0:3] = np.reshape(velo2cam['R'], [3,3])
        Tr_velo_to_cam[:,3] = velo2cam['T']
        data['Tr_velo_to_cam'] = np.reshape(Tr_velo_to_cam, [12])
        data['R0_rect'] = cam2cam['R_rect_00']
        data['P2'] = cam2cam['P_rect_02']
        return data

    def cart2hom(self, pts_3d):
        ''' Input: nx3 points in Cartesian
            Oupput: nx4 points in Homogeneous by pending 1
        '''
        n = pts_3d.shape[0]
        pts_3d_hom = np.hstack((pts_3d, np.ones((n,1))))
        return pts_3d_hom

    # ===========================
    # ------- 3d to 3d ----------
    # ===========================
    def project_velo_to_ref(self, pts_3d_velo):
        pts_3d_velo = self.cart2hom(pts_3d_velo) # nx4
        return np.dot(pts_3d_velo, np.transpose(self.V2C))

    def project_ref_to_velo(self, pts_3d_ref):
        pts_3d_ref = self.cart2hom(pts_3d_ref) # nx4
        return np.dot(pts_3d_ref, np.transpose(self.C2V))

    def project_rect_to_ref(self, pts_3d_rect):
        ''' Input and Output are nx3 points '''
        return np.transpose(np.dot(np.linalg.inv(self.R0), np.transpose(pts_3d_rect)))

    def project_ref_to_rect(self, pts_3d_ref):
        ''' Input and Output are nx3 points '''
        return np.transpose(np.dot(self.R0, np.transpose(pts_3d_ref)))

    def project_rect_to_velo(self, pts_3d_rect):
        ''' Input: nx3 points in rect camera coord.
            Output: nx3 points in velodyne coord.
        '''
        pts_3d_ref = self.project_rect_to_ref(pts_3d_rect)
        return self.project_ref_to_velo(pts_3d_ref)

    def project_velo_to_rect(self, pts_3d_velo):
        pts_3d_ref = self.project_velo_to_ref(pts_3d_velo)
        return self.project_ref_to_rect(pts_3d_ref)

    def corners3d_to_img_boxes(self, corners3d):
        """
        :param corners3d: (N, 8, 3) corners in rect coordinate
        :return: boxes: (None, 4) [x1, y1, x2, y2] in rgb coordinate
        :return: boxes_corner: (None, 8) [xi, yi] in rgb coordinate
        """
        sample_num = corners3d.shape[0]
        corners3d_hom = np.concatenate((corners3d, np.ones((sample_num, 8, 1))), axis=2)  # (N, 8, 4)

        img_pts = np.matmul(corners3d_hom, self.P.T)  # (N, 8, 3)

        x, y = img_pts[:, :, 0] / img_pts[:, :, 2], img_pts[:, :, 1] / img_pts[:, :, 2]
        x1, y1 = np.min(x, axis=1), np.min(y, axis=1)
        x2, y2 = np.max(x, axis=1), np.max(y, axis=1)

        boxes = np.concatenate((x1.reshape(-1, 1), y1.reshape(-1, 1), x2.reshape(-1, 1), y2.reshape(-1, 1)), axis=1)
        boxes_corner = np.concatenate((x.reshape(-1, 8, 1), y.reshape(-1, 8, 1)), axis=2)

        return boxes, boxes_corner


    # ===========================
    # ------- 3d to 2d ----------
    # ===========================
    def project_rect_to_image(self, pts_3d_rect):
        ''' Input: nx3 points in rect camera coord.
            Output: nx2 points in image2 coord.
        '''
        pts_3d_rect = self.cart2hom(pts_3d_rect)
        pts_2d = np.dot(pts_3d_rect, np.transpose(self.P)) # nx3
        pts_2d[:,0] /= pts_2d[:,2]
        pts_2d[:,1] /= pts_2d[:,2]
        return pts_2d[:,0:2]

    def project_velo_to_image(self, pts_3d_velo):
        ''' Input: nx3 points in velodyne coord.
            Output: nx2 points in image2 coord.
        '''
        pts_3d_rect = self.project_velo_to_rect(pts_3d_velo)
        return self.project_rect_to_image(pts_3d_rect)

    # ===========================
    # ------- 2d to 3d ----------
    # ===========================
    def project_image_to_rect(self, uv_depth):
        ''' Input: nx3 first two channels are uv, 3rd channel
                   is depth in rect camera coord.
            Output: nx3 points in rect camera coord.
        '''
        n = uv_depth.shape[0]
        x = ((uv_depth[:,0]-self.c_u)*uv_depth[:,2])/self.f_u + self.b_x
        y = ((uv_depth[:,1]-self.c_v)*uv_depth[:,2])/self.f_v + self.b_y
        pts_3d_rect = np.zeros((n,3))
        pts_3d_rect[:,0] = x
        pts_3d_rect[:,1] = y
        pts_3d_rect[:,2] = uv_depth[:,2]
        return pts_3d_rect

    def project_image_to_velo(self, uv_depth):
        pts_3d_rect = self.project_image_to_rect(uv_depth)
        return self.project_rect_to_velo(pts_3d_rect)


def rotx(t):
    ''' 3D Rotation about the x-axis. '''
    c = np.cos(t)
    s = np.sin(t)
    return np.array([[1,  0,  0],
                     [0,  c, -s],
                     [0,  s,  c]])


def roty(t):
    ''' Rotation about the y-axis. '''
    c = np.cos(t)
    s = np.sin(t)
    return np.array([[c,  0,  s],
                     [0,  1,  0],
                     [-s, 0,  c]])


def rotz(t):
    ''' Rotation about the z-axis. '''
    c = np.cos(t)
    s = np.sin(t)
    return np.array([[c, -s,  0],
                     [s,  c,  0],
                     [0,  0,  1]])


def transform_from_rot_trans(R, t):
    ''' Transforation matrix from rotation matrix and translation vector. '''
    R = R.reshape(3, 3)
    t = t.reshape(3, 1)
    return np.vstack((np.hstack([R, t]), [0, 0, 0, 1]))


def inverse_rigid_trans(Tr):
    ''' Inverse a rigid body transform matrix (3x4 as [R|t])
        [R'|-R't; 0|1]
    '''
    inv_Tr = np.zeros_like(Tr) # 3x4
    inv_Tr[0:3,0:3] = np.transpose(Tr[0:3,0:3])
    inv_Tr[0:3,3] = np.dot(-np.transpose(Tr[0:3,0:3]), Tr[0:3,3])
    return inv_Tr

def read_label(label_filename):
    lines = [line.rstrip() for line in open(label_filename)]
    objects = [Object3d(line) for line in lines]
    return objects

def load_image(img_filename):
    return cv2.imread(img_filename)

def load_velo_scan(velo_filename):
    scan = np.fromfile(velo_filename, dtype=np.float32)
    scan = scan.reshape((-1, 4))
    return scan
kitti_object.py
from __future__ import print_function

import os
import sys
import cv2
import numpy as np
from PIL import Image
import matplotlib.pyplot as plt
BASE_DIR = os.path.dirname(os.path.abspath(__file__))
ROOT_DIR = os.path.dirname(BASE_DIR)
sys.path.append(os.path.join(ROOT_DIR, 'mayavi'))
import kitti_util as utils


'''
在图像中画2D框、3D框
'''
def show_image_with_boxes(img, objects, calib, show3d=True):
    img1 = np.copy(img) # for 2d bbox
    img2 = np.copy(img) # for 3d bbox
    for obj in objects:
        if obj.type=='DontCare':continue
        cv2.rectangle(img1, (int(obj.xmin),int(obj.ymin)), (int(obj.xmax),int(obj.ymax)), (0,255,0), 2) # 画2D框
        box3d_pts_2d, box3d_pts_3d = utils.compute_box_3d(obj, calib.P) # 获取图像3D框(8*2)、相机坐标系3D框(8*3)
        img2 = utils.draw_projected_box3d(img2, box3d_pts_2d) # 在图像上画3D框
    if show3d:
        Image.fromarray(img2).save('save_output/image_with_3Dboxes.png')
        Image.fromarray(img2).show()
    else:
        Image.fromarray(img1).save('save_output/image_with_2Dboxes.png')
        Image.fromarray(img1).show()


'''
可视化BEV鸟瞰图
'''
def show_lidar_topview(pc_velo, objects, calib):
      # 1-设置鸟瞰图范围
    side_range = (-30, 30)  # 左右距离
    fwd_range = (0, 80)  # 后前距离

    x_points = pc_velo[:, 0]
    y_points = pc_velo[:, 1]
    z_points = pc_velo[:, 2]

    # 2-获得区域内的点
    f_filt = np.logical_and(x_points > fwd_range[0], x_points < fwd_range[1])
    s_filt = np.logical_and(y_points > side_range[0], y_points < side_range[1])
    filter = np.logical_and(f_filt, s_filt)
    indices = np.argwhere(filter).flatten()
    x_points = x_points[indices]
    y_points = y_points[indices]
    z_points = z_points[indices]

    # 定义了鸟瞰图中每个像素代表的距离
    res = 0.1
    # 3-1将点云坐标系 转到 BEV坐标系
    x_img = (-y_points / res).astype(np.int32)
    y_img = (-x_points / res).astype(np.int32)
    # 3-2调整坐标原点
    x_img -= int(np.floor(side_range[0]) / res)
    y_img += int(np.floor(fwd_range[1]) / res)
    print(x_img.min(), x_img.max(), y_img.min(), y_img.max())

    # 4-填充像素值, 将点云数据的高度信息(Z坐标)映射到像素值
    height_range = (-3, 1.0)
    pixel_value = np.clip(a=z_points, a_max=height_range[1], a_min=height_range[0])


    def scale_to_255(a, min, max, dtype=np.uint8):
        return ((a - min) / float(max - min) * 255).astype(dtype)

    pixel_value = scale_to_255(pixel_value, height_range[0], height_range[1])

    # 创建图像数组
    x_max = 1 + int((side_range[1] - side_range[0]) / res)
    y_max = 1 + int((fwd_range[1] - fwd_range[0]) / res)
    im = np.zeros([y_max, x_max], dtype=np.uint8)
    im[y_img, x_img] = pixel_value

    im2 = Image.fromarray(im)
    im2.save('save_output/BEV.png')
    im2.show()


'''
将点云数据3D框投影到BEV
'''
def show_lidar_topview_with_boxes(img, objects, calib):
    def bbox3d(obj):
        box3d_pts_2d, box3d_pts_3d = utils.compute_box_3d(obj, calib.P) # 获取3D框-图像、3D框-相机坐标系
        box3d_pts_3d_velo = calib.project_rect_to_velo(box3d_pts_3d) # 将相机坐标系的框 转到 激光雷达坐标系
        return box3d_pts_3d_velo # 返回nx3的点

    boxes3d = [bbox3d(obj) for obj in objects if obj.type == "Car"]
    gt = np.array(boxes3d)
    im2 = utils.draw_box3d_label_on_bev(img, gt, scores=None, thickness=1) # 获取激光雷达坐标系的3D点,选择x, y两维,画到BEV平面坐标系上
    im2 = Image.fromarray(im2)
    im2.save('save_output/BEV with boxes.png')
    im2.show()


'''
将点云数据投影到图像
'''
def show_lidar_on_image(pc_velo, img, calib, img_width, img_height):
    ''' Project LiDAR points to image '''
    imgfov_pc_velo, pts_2d, fov_inds = get_lidar_in_image_fov(pc_velo,
        calib, 0, 0, img_width, img_height, True)
    imgfov_pts_2d = pts_2d[fov_inds,:]
    imgfov_pc_rect = calib.project_velo_to_rect(imgfov_pc_velo)

    import matplotlib.pyplot as plt
    cmap = plt.cm.get_cmap('hsv', 256)
    cmap = np.array([cmap(i) for i in range(256)])[:,:3]*255

    for i in range(imgfov_pts_2d.shape[0]):
        depth = imgfov_pc_rect[i,2]
        color = cmap[int(640.0/depth),:]
        cv2.circle(img, (int(np.round(imgfov_pts_2d[i,0])),
            int(np.round(imgfov_pts_2d[i,1]))),
            2, color=tuple(color), thickness=-1)
    Image.fromarray(img).save('save_output/lidar_on_image.png')
    Image.fromarray(img).show()
    return img


'''
将点云数据投影到相机坐标系
'''
def get_lidar_in_image_fov(pc_velo, calib, xmin, ymin, xmax, ymax,
                           return_more=False, clip_distance=2.0):
    ''' Filter lidar points, keep those in image FOV '''
    pts_2d = calib.project_velo_to_image(pc_velo)
    fov_inds = (pts_2d[:,0]<xmax) & (pts_2d[:,0]>=xmin) & \
        (pts_2d[:,1]<ymax) & (pts_2d[:,1]>=ymin)
    fov_inds = fov_inds & (pc_velo[:,0]>clip_distance)
    imgfov_pc_velo = pc_velo[fov_inds,:]
    if return_more:
        return imgfov_pc_velo, pts_2d, fov_inds
    else:
        return imgfov_pc_velo


'''
解析标签
'''
class kitti_object(object):
    '''Load and parse object data into a usable format.'''

    def __init__(self, root_dir, split='training'):
        '''root_dir contains training and testing folders'''
        self.root_dir = root_dir
        self.split = split
        self.split_dir = os.path.join(root_dir, split)

        if split == 'training':
            self.num_samples = 7481
        elif split == 'testing':
            self.num_samples = 7518
        else:
            print('Unknown split: %s' % (split))
            exit(-1)

        self.image_dir = os.path.join(self.split_dir, 'image_2')
        self.calib_dir = os.path.join(self.split_dir, 'calib')
        self.lidar_dir = os.path.join(self.split_dir, 'velodyne')
        self.label_dir = os.path.join(self.split_dir, 'label_2')

    def __len__(self):
        return self.num_samples

    def get_image(self, idx):
        assert(idx<self.num_samples)
        img_filename = os.path.join(self.image_dir, '%06d.png'%(idx))
        return utils.load_image(img_filename)

    def get_lidar(self, idx):
        assert(idx<self.num_samples)
        lidar_filename = os.path.join(self.lidar_dir, '%06d.bin'%(idx))
        return utils.load_velo_scan(lidar_filename)

    def get_calibration(self, idx):
        assert(idx<self.num_samples)
        calib_filename = os.path.join(self.calib_dir, '%06d.txt'%(idx))
        return utils.Calibration(calib_filename)

    def get_label_objects(self, idx):
        assert(idx<self.num_samples and self.split=='training')
        label_filename = os.path.join(self.label_dir, '%06d.txt'%(idx))
        return utils.read_label(label_filename)

    def get_depth_map(self, idx):
        pass

    def get_top_down(self, idx):
        pass
运行程序后kitti_vis_main.py后,回保存5张结果图片

后面还会介绍Nuscenes、Waymo等3D数据集。
智能推荐
python青果教务系统抢课_名额不够,技术来凑,利用Python实现教务系统强制性抢课...-程序员宅基地
文章浏览阅读1.3k次。最近一学期一次的抢课大戏又来了,几家欢乐几家愁。O(∩_∩)O哈哈~(l我每次一选就过了hah,我还是有欧的时候滴)。看着他们盯着教务系统就着急,何况我们那教务系统,不想说什么。emmm 想周围的朋友,正好下午利用扩容前一段时间写了个小脚本帮助朋友抢课。(当然抢到了啦,^_^)私信小编001即可获取大量Python学习资料,名额有限因为时间不够,来不及仔细琢磨,我第一想法就是直接提交选课的数据包(..._青果教务系统抢课
windows 加 switchyomega + burp 抓https包-程序员宅基地
文章浏览阅读4.6k次。很简单,下载证书后导入到受信任根目录证书下载,直接在代理状态浏览器访问burp点击CA就可以下载了 设置该证书全部信任,,switchyomega 设置如下即可 就可以抓https的包了 ...
用C语言写循环赛日程表,循环赛的方法与编排-程序员宅基地
文章浏览阅读1k次。一、循环赛的种类与特点(一)循环赛的种类循环赛又称循环法。是指参赛队(或个人,下同)之间,都要互相轮流比赛,最后按照各参赛队在全部比赛中的胜负场数、得分多少排定名次的比赛方法。它在对抗性项目比赛中经常被采用。循环赛包括单循环、双循环或分组循环三种。单循环是所有参赛队(人)相互轮赛一次;双循环是所有参赛队(人)相互轮赛二次;分组循环是参赛队(人)较多时,采用种子法,把强队(人)分散在各组,先进行小组..._c语言循环赛互打一场比赛 甲队两胜
springboot项目访问html页面,发现端口不一致&继承WebMvcConfigurationSupport类会导致自动配置失效_springboot项目前端端口号不同怎么办-程序员宅基地
文章浏览阅读1.6k次,点赞4次,收藏6次。最后的解决方法“在config--WebMvcConfig中不要继承WebMvcConfigurationSupport,而是实现WebMvcConfigurer接口”,且不要在idea中直接点击浏览器图标打开对应的html页面,要自己在浏览器输入url。在本次debug过程中,更加清楚地明白了,springboot项目启动过程中,只扫描引导类同包或子包下的程序,而在resources目录下的静态资源文件(没放到),需要被映射,才能被扫描到。_springboot项目前端端口号不同怎么办
k8s.配置管理.configmap&secret_configmap @value-程序员宅基地
文章浏览阅读80次。configmap 和secret 都需要提前创建configmap和secret都可以为pod提供挂载和变量的方式变量的方式有envfrom全部变量和valuefrom单个变量的引用configmap和secret 需要和引用的pod或者资源对象在同一个ns下。_configmap @value
System.TypeInitializationException: 'The type initializer for 'MySql.Data.MySqlClient.Replication.Re...-程序员宅基地
文章浏览阅读2.2k次。下午在调试的时候报错数据库连接就报错我就很纳闷后面用原来的代码写发现还是报错System.TypeInitializationException:'The type initializer for 'MySql.Data.MySqlClient.Replication.ReplicationManager' threw an exception.'应该是出在Mysql包上的问题..._system.typeinitializationexception:““mysql.data.mysqlclient.mysqlpoolmanag
随便推点
二、RSA加密_ctf rsa 多个n和多个c-程序员宅基地
文章浏览阅读3.4k次。CTF中的RSA及攻击方法笔记1 数论基础1.1 模运算规则2 RSA相关题目2.1 已知 n,e,c 求 m2.2 已知 p,q,e 求 d2.3 已知dp,dq,c,p,q 求m2.4 仅已知c,c特别大 【c = m^e mod n】2.5 已知n1,n2,c1,c2,n 求 m2.6 已知n1,n2,e,c2 求m2.7 已知e,d,N 求p,q1 数论基础参考链接:https://www.freebuf.com/articles/web/257835.html1.1 模运算规则模运算与基_ctf rsa 多个n和多个c
mysql中把bigint类型转换为时间格式,与hive中unix_timestamp、FROM_UNIXTIME两个函数之间的区别_bigint转日期-程序员宅基地
文章浏览阅读2w次,点赞4次,收藏15次。数据库中时间类型是这样的,13位bigInt类型的数据select date_format(FROM_UNIXTIME(列名/1000),'%Y%m%d') from xx表原理就是把13位的时间格式/1000等于时间戳,使用FROM_UNIXTIME把时间戳转换成具体的日期ps:将时间转换为时间戳select unix_timestamp('2018-08-30..._bigint转日期
exit status 5: �ܾ����ʡ� exit status 1: ���_exit status 5: exit status 1:-程序员宅基地
文章浏览阅读1.1k次。使用nvm切换node版本出现上述乱码时。使用管理员模式打开CMD就可以解决了~_exit status 5: exit status 1:
对Java和Linux的认识,Java类的认识-程序员宅基地
文章浏览阅读279次。Java使用类来构造自己的数据类型,类其实就是对一类数据和行为的数据封装;可以达到低耦合功能;Java注意啦:用类也是我们为了定义自己数据类型的一种方法,所以结构体,共用体也是一样的;都是为了处理数据而用的方法!类的存放问题: java源代码文件是以类为中心的,一个类的定义源码必须只在一个源文件实现;一个“文件名.java”文件名必须与文件中用public class 修饰的类名一致,java语法..._linux和java
快给你的Vue项目添加一个编辑图片组件吧_vue-image-editor-程序员宅基地
文章浏览阅读8.2k次,点赞20次,收藏59次。快给你的Vue项目添加一个编辑图片组件吧给大家推荐一款功能极其强大的图片编辑插件 tui.image-editor快速体验首选在你的前端项目中安装:npm i tui-image-editor// oryarn add tui-image-editor现在你就去新建一个.vue文件,复制进去下面这段代码:<template> <div id="tui-image-editor"></div></template><scr_vue-image-editor
Flutter混合开发-Null check operator used on a null value_flutter null check operator used on a null value-程序员宅基地
文章浏览阅读4.8k次。标题Flutter与Android混编在Android与Flutter混编中导入flutter的GetX框架时,配置getPages参数出错,在编译时不报错,但是运行之后,debug模式下出现红底白色的错误,错误显示为 Null check operator used on a null value,看一眼懵了,本地开发版本使用的是flutter2,配置的Getx库也确实在很早的版本中就支持了Null safety ,且配置的getPages为数组并且可为空,按照常理怎么也不可能出现这个错误!尝试的方案_flutter null check operator used on a null value