如何在Visual Studio Code中调试Python脚本-程序员宅基地
技术标签: python java linux 编程语言 人工智能
In this article, I am going to explain how we can easily debug Python scripts using the Visual Studio (VS) Code. In my previous article on this topic, I have explained how to set up a development environment to start coding in Python. I would definitely recommend reading that article if you have not setup your Visual Studio Code environment yet. This article can be considered as a continuation from the above-mentioned steps as I am assuming that you are already into programming in Python using the VS Code.
在本文中,我将解释如何使用Visual Studio(VS)代码轻松调试Python脚本。 在上一篇关于该主题的文章中,我解释了如何设置开发环境以开始使用Python进行编码 。 如果您尚未设置Visual Studio Code环境,我绝对建议您阅读该文章。 可以将本文视为上述步骤的续篇,因为我假设您已经开始使用VS Code在Python中进行编程。
需要调试代码 (The need for debugging code)
While we talk about how to debug Python scripts in VS code, it is essential for us to know why we should debug our code in the first place. Not only for Python, debugging is related to every other programming language in the world, starting from C, C++, JavaScript, and so on. In the software programming world, debugging is the process that allows the programmer to identify and locate bugs/errors in the existing code. Debugging is an integral part of any software development life cycle and sometimes it can take more time to debug code than to write the same.
当我们谈论如何在VS代码中调试Python脚本时,对我们来说至关重要的是要知道为什么首先应该调试我们的代码。 不仅对于Python,调试还与世界上所有其他编程语言都息息相关,从C,C ++,JavaScript等开始。 在软件编程世界中,调试是使程序员能够识别和定位现有代码中的错误/错误的过程。 调试是任何软件开发生命周期不可或缺的一部分,有时调试代码要比编写代码花费更多的时间。
调试与测试相同吗? (Is debugging the same as testing?)
Not really, debugging and testing are two different terms and should not be confused with one another. Let me clear this out. Suppose you are developing a new project and you have written all your code and as per the business the requirements the code works well. Now, once you are done with the development, this code will be assigned to the QA engineer whose job is to test the application that you just developed. Let us assume that although the application works fine functionally, there is some issue due to which a calculation is being wrongly displayed. The QA engineer will then identify this as a defect/bug in your code and assign it back to you so that you can fix it.
并非如此,调试和测试是两个不同的术语,不应相互混淆。 让我清除这一点。 假设您正在开发一个新项目,并且您已经编写了所有代码,并且根据业务需求,该代码运行良好。 现在,一旦完成开发,此代码将分配给QA工程师,其工作是测试刚刚开发的应用程序。 让我们假设尽管该应用程序在功能上运行良好,但是由于某些问题导致计算显示错误。 然后,质量检查工程师将其识别为代码中的缺陷/错误,并将其分配给您,以便您进行修复。
Now, when you reproduce the code on your machine, your job is to identify the piece of code which is responsible for those calculations and identify the glitch in there. This process of identifying the correct code and trying to fix it with or finding another workaround is known as debugging. Although Visual Studio Code is capable of debugging most of the programming languages, we will use Python in this tutorial.
现在,当您在计算机上重现代码时,您的工作是确定负责这些计算的代码段,并确定其中的故障。 识别正确的代码并尝试使用正确的代码进行修复或寻找其他解决方法的过程称为调试。 尽管Visual Studio Code能够调试大多数编程语言,但在本教程中我们将使用Python。
在VS Code中调试Python脚本 (Debug Python scripts in VS Code)
Assuming that you have already set up your Python development environment, let us now understand how to debug Python scripts from VS Code directly. I will begin by writing some sample code which can be used for demonstration purposes. Please note that we will only focus on the debugging and writing the Python script is out of scope for this article.
假设您已经设置了Python开发环境,现在让我们了解如何直接从VS Code调试Python脚本。 我将首先编写一些示例代码,这些示例代码可用于演示。 请注意,我们将只专注于调试,而编写Python脚本超出了本文的范围。
Head over to the Visual Studio Code and create a new Python file. You can also use an existing file if you already have one. I am using the following code for demonstration purposes.
转到Visual Studio Code并创建一个新的Python文件。 如果已有文件,也可以使用现有文件。 我将以下代码用于演示目的。
# Debugging simple variable statements.
number = 100
print(f'Number is {number}')

number = 500
print(f'New Number is {number}')

# Debugging a for loop
userList = ['Rob','Dave','Fred']

for user in userList:
    print(user)
As you might be aware, you can just run this code by simply selecting Run Python File in Terminal from the context menu or by clicking on the Run icon on the top right corner. The following will be the result after the script is successfully executed.
您可能已经知道,只需在上下文菜单中选择“在Terminal中运行Python文件”,或单击右上角的“运行”图标 ,即可运行此代码。 以下是成功执行脚本后的结果。
Figure 1 – Executing Python Code in the Terminal
图1 –在终端中执行Python代码
Now that we know our code is executed, we can go ahead and run the debugger to test the code and the execution flow as well. You can start the debugger in the following ways.
现在我们知道我们的代码已执行,我们可以继续运行调试器以测试代码和执行流程。 您可以通过以下方式启动调试器。
- Start Debugging from the 运行菜单中选择Run menu 开始调试
- Run icon from the left pane and click on 运行”图标 ,然后单击“ Run and Debug 运行并调试”
- F5 on the keyboard F5
I would like to go with the second option and hit Run and Debug.
我想选择第二个选项,然后单击“运行并调试” 。
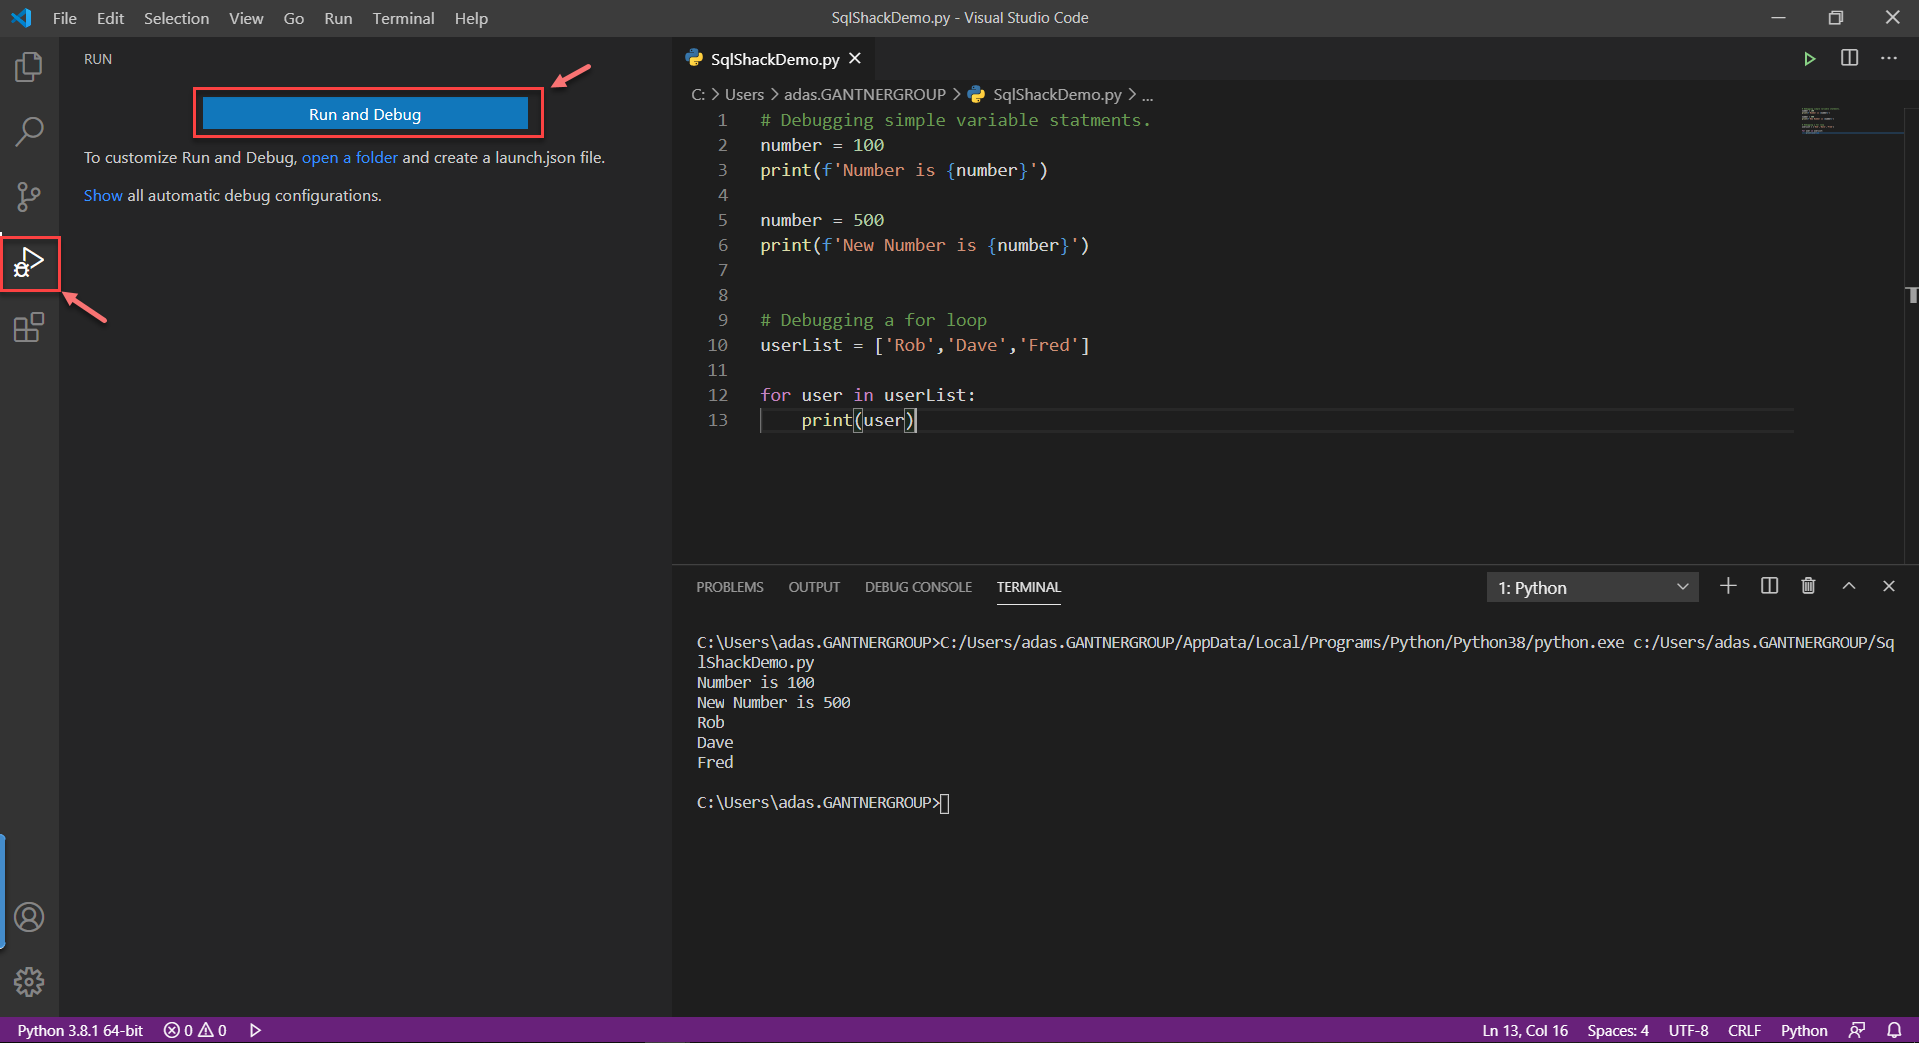
Figure 2 – Debug Python Scripts in VS Code
图2 –在VS代码中调试Python脚本
As soon as you hit the Run and Debug button, a popup will appear in VS Code which will prompt you to choose the Debug Configuration that you would like to use. Let us go ahead with the Python File option for the time being. You can select other debug configurations based on the application that you are working with.
按下“ 运行并调试”按钮后,VS Code中将出现一个弹出窗口,提示您选择要使用的调试配置 。 现在让我们继续使用Python File选项。 您可以根据正在使用的应用程序选择其他调试配置。
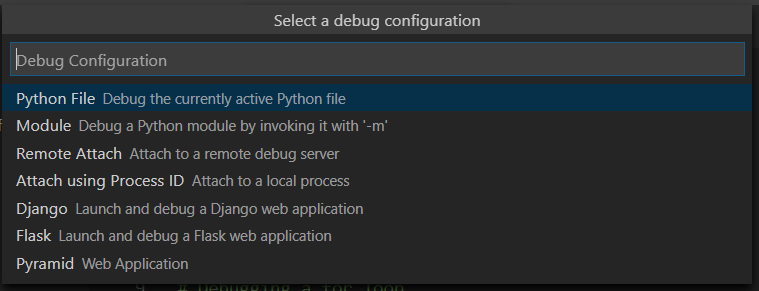
Figure 3 – Selecting Debug Configuration in the VS Code
图3 –在VS代码中选择调试配置
As you select the debug configuration in Visual Studio Code, you can see that the Terminal window opens up from the bottom and the debugger starts executing your code.
在Visual Studio Code中选择调试配置时,可以看到“终端”窗口从底部打开,调试器开始执行代码。
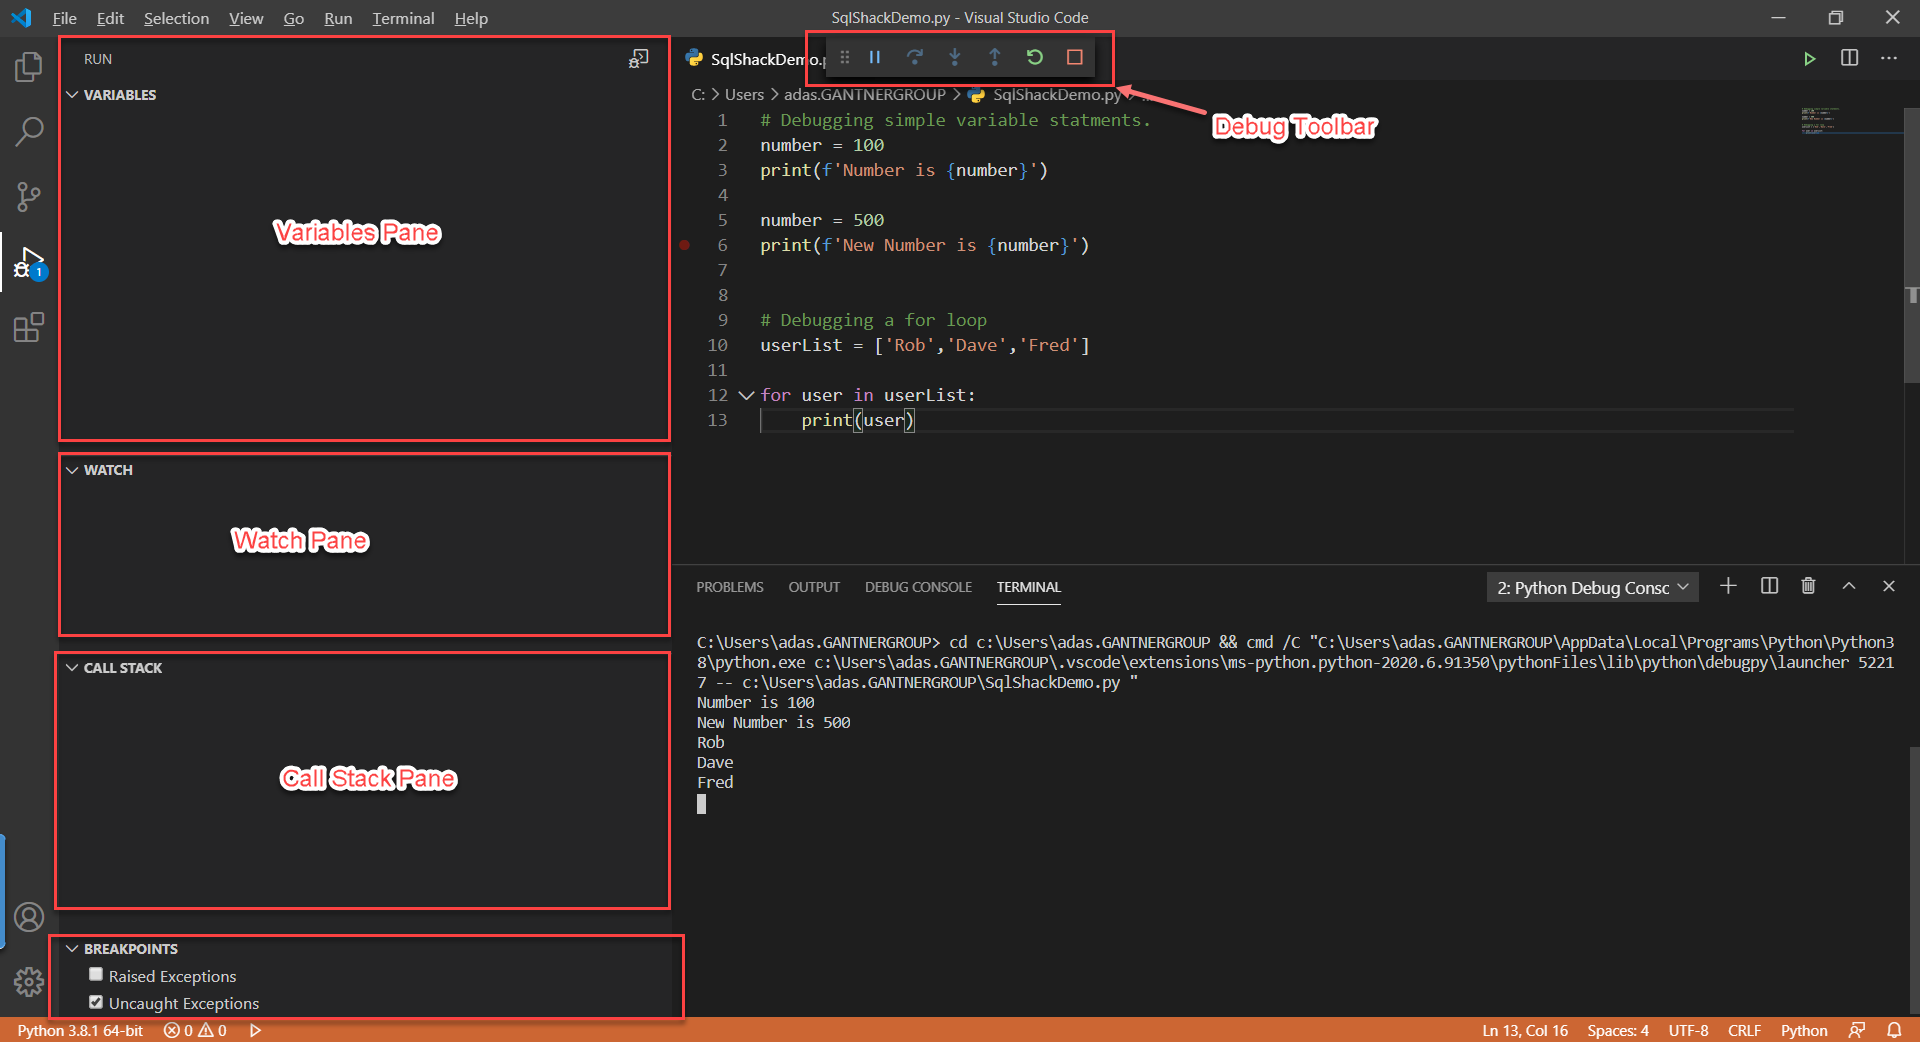
Figure 4 – Debugger started
图4 –调试器已启动
Let me quickly explain the various areas that you can see on the screen.
让我快速解释一下您可以在屏幕上看到的各个区域。
Debug Toolbar – This is the main toolbar that allows you to navigate along with your code as you try to debug it. There are six actions on this toolbar which are as follows:
调试工具栏 –这是主要工具栏,可让您在尝试调试代码时随代码一起导航。 此工具栏上有六个操作,如下所示:
Figure 5 – Debug Toolbar
图5 –调试工具栏
- Continue/Pause (F5) – Allows you to pause or continue the debugging process 继续/暂停(F5)–允许您暂停或继续调试过程
- Step Over (F10) – Allows you to move over to the next line of code 单步执行(F10)–允许您移至下一行代码
- Step Into (F11) – Allows you to enter inside a different method during debugging 单步执行(F11)–允许您在调试期间输入其他方法
- Step Out (Shift+F11) – Allows you to move to the parent stack 移出(Shift + F11)–允许您移至父堆栈
- Restart (Ctrl+Shift+F5) – Restarts the debugging session from the beginning 重新启动(Ctrl + Shift + F5)–从头开始重新启动调试会话
- Stop (Shift+F5) – Stops the debugging session 停止(Shift + F5)–停止调试会话
Variables Pane – Using the variables pane you can easily inspect the data elements within your program. When you start debugging a lot of system-defined variables are initiated along with the user-defined variables. During the debugging session, you can verify the values of each of those variables from this pane.
变量窗格 –使用变量窗格,您可以轻松检查程序中的数据元素。 开始调试时,会同时启动许多系统定义的变量和用户定义的变量。 在调试会话期间,您可以从此窗格验证每个变量的值。
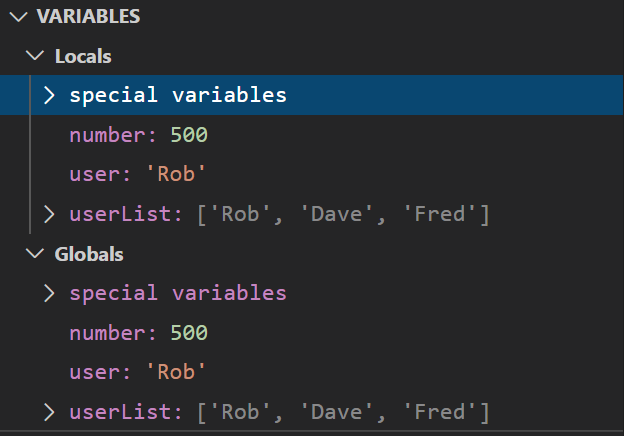
Figure 6 – Variables Pane in the VS Code
图6 – VS代码中的变量窗格
Watch Pane – Sometimes you may write a program with hundreds of variables within it. It is not possible to monitor the values of all those variables from the Variables pane as mentioned above. In such a case, you might want to monitor only one or two variables of your choice leaving the worry about the rest. You can add those variables to your watch list, and you can easily monitor the status and the values for those particular variables within this pane.
看板 –有时您可能会编写一个包含数百个变量的程序。 如上所述,无法从“变量”窗格监视所有这些变量的值。 在这种情况下,您可能只想监视您选择的一个或两个变量,而不必担心其余的变量。 您可以将这些变量添加到监视列表中,并且可以在此窗格中轻松监视这些特定变量的状态和值。
Figure 7 – Watch Pane in VS Code
图7 – VS代码中的监视窗格
Call Stack Pane – This is helpful when your code has a lot of inner methods and you navigate deep inside a stack and then you might lose track of your stack. When there is any error in your program you can easily know from which stack is the error has occurred and then debug it accordingly.
调用堆栈窗格 –当您的代码具有很多内部方法并且在堆栈内部进行深入导航时可能会有所帮助,这很有用。 当程序中有任何错误时,您可以轻松地从哪个堆栈中发现错误发生了,然后进行相应的调试。
Breakpoints – This is an important concept while debugging code in any language. You may notice that while you initially started the debugger session, the terminal just executed the script and the debugging session stopped automatically. What if you want to stop the debugging session at some particular line and monitor the variables closely? In such a case, the breakpoints come to our rescue. You can attach a breakpoint to any line by just click on the left of the line number. A red dot will appear which means that the breakpoint has been defined for that line. The next time when you debug, you can see that the program stops the execution at the line and waits for your command. You can now use the Debug Toolbar to navigate along with your code.
断点–这是调试任何语言的代码时的重要概念。 您可能会注意到,在最初启动调试器会话时,终端仅执行了脚本,调试会话自动停止。 如果要在某些特定的行上停止调试会话并密切监视变量怎么办? 在这种情况下,断点就可以解决。 只需单击行号左侧,即可将断点附加到任何行。 将出现一个红点,表示已为该行定义了断点。 下次调试时,您会看到程序在该行停止执行并等待命令。 现在,您可以使用“调试工具栏”与代码一起导航。
Figure 8 – Breakpoints in VS Code
图8 – VS代码中的断点
结论 (Conclusion)
In this article, we have talked about the various topics on how to debug Python scripts in Visual Studio Code. As already discussed, Visual Studio Code is by far one of the simplest, yet powerful tools from Microsoft and used by many developers for the development of their applications. While writing complex applications, it often becomes a pain point to identify bugs in the existing system. In order to understand the complete flow and remove those bugs, debugging helps us to identify those pain points and understand them with more details about the execution flow of the application. Debugging should be considered as one of the core parts of any application development.
在本文中,我们讨论了有关如何在Visual Studio Code中调试Python脚本的各种主题。 正如已经讨论过的,Visual Studio Code到目前为止是Microsoft提供的最简单但功能强大的工具之一,许多开发人员都在使用Visual Studio Code来开发其应用程序。 在编写复杂的应用程序时,识别现有系统中的错误通常会很痛苦。 为了了解完整的流程并消除这些错误,调试可以帮助我们识别这些痛点,并通过有关应用程序执行流程的更多详细信息来理解它们。 调试应被视为任何应用程序开发的核心部分之一。
翻译自: https://www.sqlshack.com/how-to-debug-python-scripts-in-visual-studio-code/
智能推荐
【单片机毕业设计】【mcuclub-dz-191】基于单片机的GSM指纹密码锁系统设计-程序员宅基地
文章浏览阅读43次。随着科技的不断发展,人们对安全性的需求逐渐提升,特别是在门锁领域。传统的机械锁由于易于复制、钥匙笨重和易丢失等问题已不再满足安全和便利的要求。本研究致力于设计开发一种指纹密码锁,该锁具备操作便捷、安全可靠和用户权限分级等特点。本文系统地从结构、硬件电路、控制软件等方面进行了详细阐述,并通过测试验证,实现了设计目标。首先,研究了指纹密码锁的结构系统。该锁的控制方案通过程序验证用户录入的指纹或输入的密码是否有效,以实现开锁。指纹密码锁的核心在于指纹传感器,本设计所采用的单片机类型为STC12C5A60S2。具体
对抗攻击经典论文剖析(上)【FGSM、BIM、PGD、Carlini and Wagner Attacks (C&W)】_bim攻击-程序员宅基地
文章浏览阅读2w次,点赞32次,收藏147次。最近做数据增广做的心累,想要看一看对抗攻击!这个博文会对四种经典算法进行剖析,分别是FGSM、BIM、PGD、Carlini and Wagner Attacks (C&W)。对抗攻击和防御首先我们简单来说一说对抗攻击和防御的目的。攻击就是对原始样本增加扰动生成对抗版本最大化损失函数,同时扰动尽可能地小,让人类肉眼无法察觉;防御问题是基于这种攻击方法训练一个更具鲁棒性的神经网络。数学表..._bim攻击
HDFS:Edits和Fsimage详解与合并流程_为什么要将edit logs和fsimage定期合并。-程序员宅基地
文章浏览阅读2.6k次,点赞8次,收藏19次。HDFS:Edits和Fsimage详解与合并流程NameNode如何管理和存储元数据计算机中存储数据有两种:内存或磁盘元数据存储磁盘: 存储磁盘无法面对客户端对元数据信息的任意的快速低延迟的响应,但是安全性高元数据存储内存:元数据存放内存,可以高效的查询以及快速响应客户端的查询请求,数据保存在内存,如果断电,内存中的数据全部丢失因此,考虑上述两种存储方式的优缺点,HDFS采用了内存+磁盘的形式来管理元数据。即: NameNode(内存)+FsImage文件. 其中,NameNode文件维护了文件_为什么要将edit logs和fsimage定期合并。
import math在python种中的意思,Python中import使用-程序员宅基地
文章浏览阅读2.4w次,点赞2次,收藏10次。import的使用举例:#coding:utf-8import mathr=5print("半径是5的圆面积是:%.2f"%(math.pi*r**2))import math的意思为从Python标准库中引入math.py模块,这是Python中定义的引入模块的方法。import的标准语法如下:import module1[, module2[,… moduleN]]表示允许一个import导入..._import math
OpenAI新版GPT-4 Turbo向付费ChatGPT用户开放使用-程序员宅基地
文章浏览阅读447次,点赞8次,收藏8次。GPT-4 Turbo 还引入了若干新功能,如支持 JSON 模式、可复现输出和并行函数调用等,这些都是为了提高模型的实用性和灵活性。OpenAI近日宣布其新版GPT-4 Turbo模型正式向付费ChatGPT用户开放,该模型在多个关键方面进行了升级和优化。这一改进比原有的 GPT-4 模型的上下文窗口大得多,使得模型在处理长篇文章或复杂对话时更加高效。该模型在多个关键方面进行了升级和优化,旨在提供更强大的性能和更低的使用成本。这使得 Turbo 模型在理解和生成更复杂、更细致的内容方面具有更强的能力。
编译运行openvslam_libfbow.so.0.0-程序员宅基地
文章浏览阅读2k次。在编译openvslam的过程中遇到了如下几个问题:1、有关opencv中undistortPoints函数参数的问题:opencv版本过低,选用高版本即可。2、pangolin中函数was not declared。参考https://blog.csdn.net/liudahanghang/article/details/80601136把pangolin版本回退到文档中指定的ad8b5f8即可。3、报错如下:/home/yasaburo3/project/openvslam/test/open_libfbow.so.0.0
随便推点
Linux——分析和存储日志_linux c之log存储-程序员宅基地
文章浏览阅读514次。分析和存储日志_linux c之log存储
使用a标签的href来实现点击手机号拨打电话_a标签打电话-程序员宅基地
文章浏览阅读5.5k次,点赞2次,收藏4次。绝绝子,原来a标签还有这功能。在移动端页面,使用起来很方便。href = tel: + 电话号码 即可 <a :href="'tel:'+ '110' ">call police</a>_a标签打电话
android studio 代码颜色_studio蓝色是#-程序员宅基地
文章浏览阅读3.9k次。1、取消 Power Save Mode勾选位置:file - Power Save Mode2、androidstudio安装了Butter Knife插件,卸载插件就能解决问题_studio蓝色是#
详解iOS上架App Store需要的成本费用-程序员宅基地
文章浏览阅读1k次。经常收到咨询说ios app上架App Store需要多少费用?一两句话解释不清,ios APP上架涉及到方方面面,这里介绍下iosios app上架App Store需要的基本费用。APP开发的费用这里就不说,也说不清,这里介绍下APP开发好后的基本费用。一、开发者账号的费用ios APP上架App Store必须申请个苹果开发者账号,年费688.每年都需要交。苹果...
通过先序和中序数组生成后序数组_根据前序和中序得出后序数组-程序员宅基地
文章浏览阅读680次。【题目】已知一棵二叉树所有的节点值都不同,给定这棵树正确的先序和中序数组,不要重建整棵树,而是通过这两个数组直接生成正确的后序数组。public class GetPosArray { public static int[] getPosArray(int[] pre, int[] in) { if (pre == null || in == null) { return null;..._根据前序和中序得出后序数组
luogu_1346 电车-程序员宅基地
文章浏览阅读101次。#include <iostream>#include <cstdio>#include <queue>using namespace std;const int maxn=110;const int INF=1<<30;struct edge{int v,t;};int n,s,t,d[maxn];queue&l..._c语言说到有轨电车,很多人都是文明的个体,他们知道如何在一辆电车里表现。然而,总